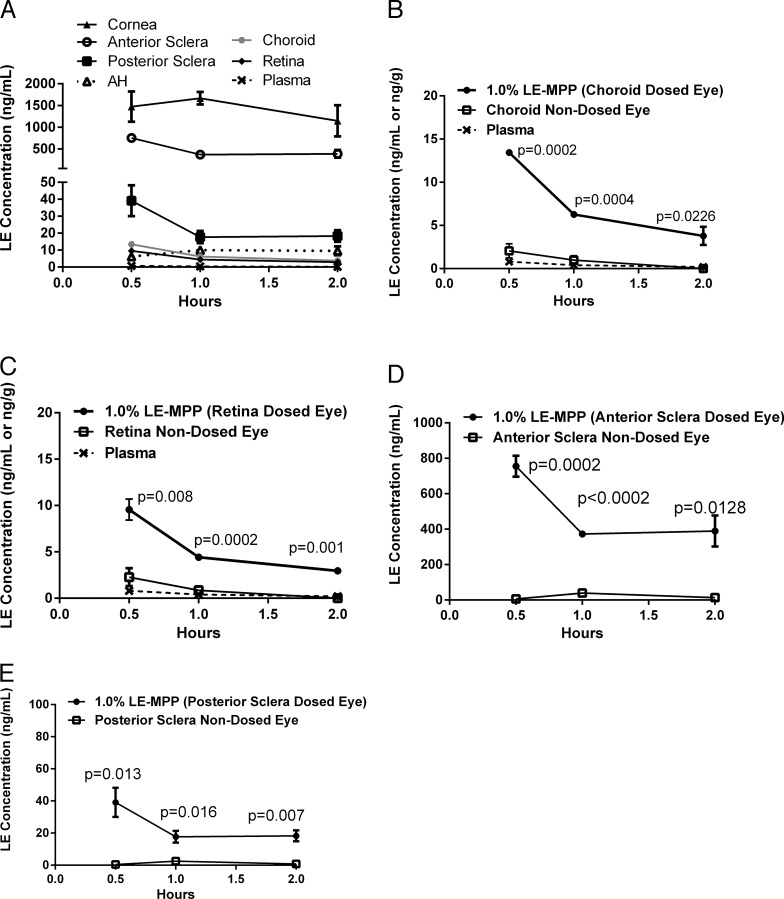
Figure 4.
The PK profiles of LE in Gottingen mini-pigs after topical administration of LE-MPP. The mean LE concentrations ± SE (ng/g, n = 3) were shown for the dosed eyes (A): cornea (solid triangle), anterior sclera (open circle), posterior sclera (solid square), AH (open triangle, dotted line), choroid (solid octagon), retina (solid diamond), plasma (x, dashed line). Dosed eyes (closed circles) versus nondosed eyes (open squares) versus plasma (x, dashed line) are shown for choroid (B), retina (C), anterior sclera (D), and posterior sclera (E). The AUC values were generated using GraphPad Prism v6.0 and ratios of dosed over nondosed eyes were determined. Statistical analysis was performed determined using the Holm-Sidak method multiple t-test, P values were shown on graphs (D, E).

