
Fig. 3.
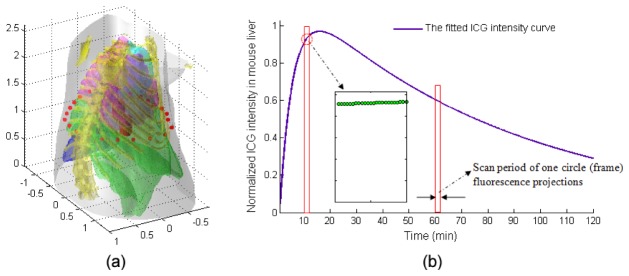
Schematic diagram of the simulation model. (a) The mouse 3-D geometry model used in simulation studies with a length of 2.6 cm from the neck to the base of liver. The red points in (a) represent the excitation point source locations. For each excitation location, the fluorescence is measured from the opposite side within field of view. (b) The intensity curve of ICG in mouse liver, which is normalized by its maximum value. Correspondingly, in forward model, the maximum intensity (concentration) inside the targets is set as 1 unit. Inset shows that ICG intensities for 24 fluorescence projections corresponding to different projection angles from scan 10 (acquired during ~10 min to 11 min).