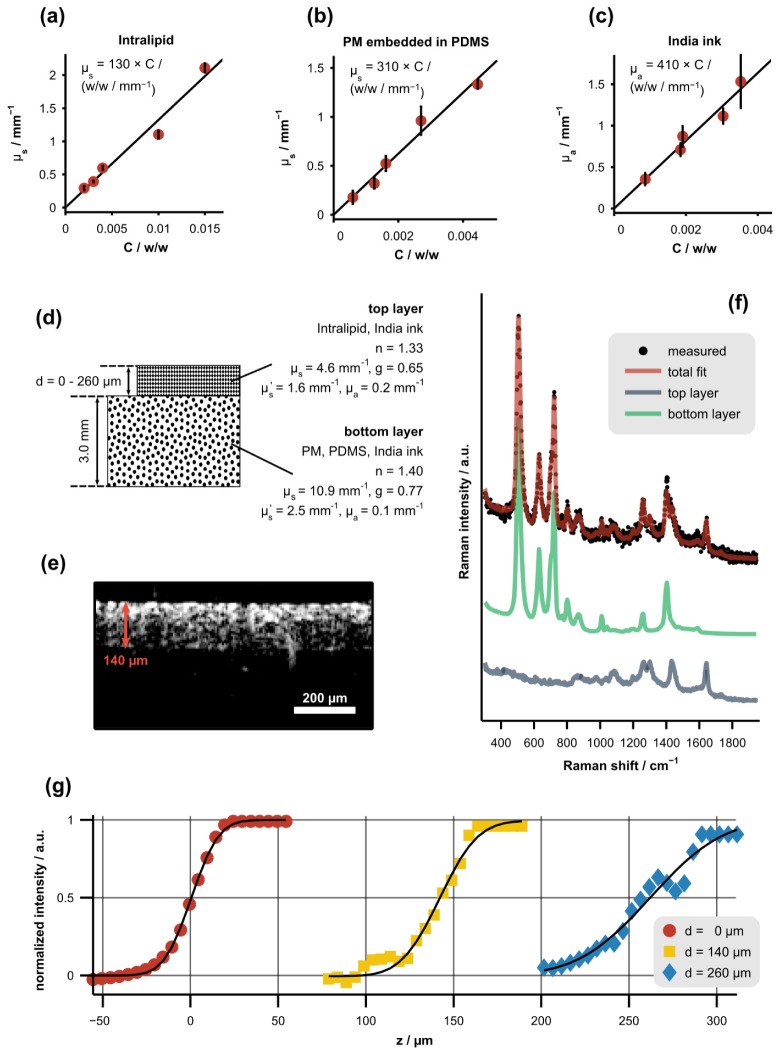
Fig. 2.
Procedure used to measure the axial resolution of the CRS subsystem as a function of sampling depth in tissue phantoms. (a)-(c) Scattering or absorption coefficient of phantom constituents versus concentration, C, along with least-squares linear fits. Error bars represent the standard deviation of each measurement. (d) Diagram depicting the optical properties (determined with 785-nm illumination) and physical dimensions of the two-layer tissue phantoms. The top layer was a mixture of Intralipid and India ink while the bottom layer was a mixture of PM, PDMS, and India ink. (e) Representative, cross-sectional OCT image of a tissue phantom with a top-layer thickness of 140 µm. (f) Representative Raman spectrum of a tissue phantom acquired near the boundary between the layers along with the corresponding least-squares fit showing the underlying spectral components (offset for clarity). (g) Normalized signal intensity of the bottom-layer spectrum versus focal position (z) for varying top-layer thicknesses, d. Each data set was fit with a Gaussian cumulative distribution function (black lines).

