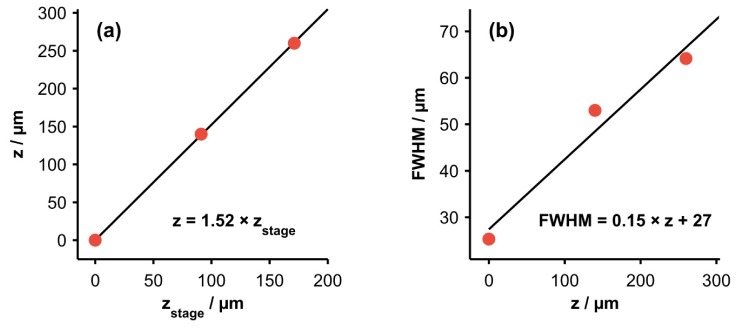
Fig. 3.

(a) Relationship between the height of the motorized translation stage, , and the CRS focal position or sampling depth, z. (b) Relationship between the axial resolution (FWHM) of CRS measurements and z. Least-squares fits suggest that both relationships are approximately linear over this range.
