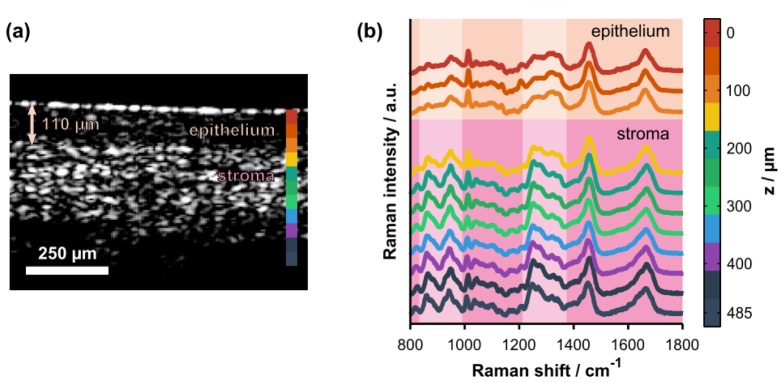
Fig. 6.

(a) Representative cross-sectional OCT image of intact, ex vivo porcine vaginal tissue. The arrow highlights the thickness of the superficial epithelium. The colorbar shows the axial locations where Raman spectra were acquired. (b) Co-localized, depth-resolved Raman spectra acquired from the same tissue sample (offset for clarity). Spectroscopic differences due to natural biochemical variation (e.g., collagen content) in the epithelium versus the stroma are highlighted by the pale-colored columns. The highlighted spectral regions include hydroxyproline and proline bands (800 – 1000 cm−1) and the amide III protein band (1200 – 1400 cm−1). Note that the Raman data were cropped to the 800 – 1800 cm−1 spectral range for display purposes only; the full spectral range was retained for quantitative analyses.
