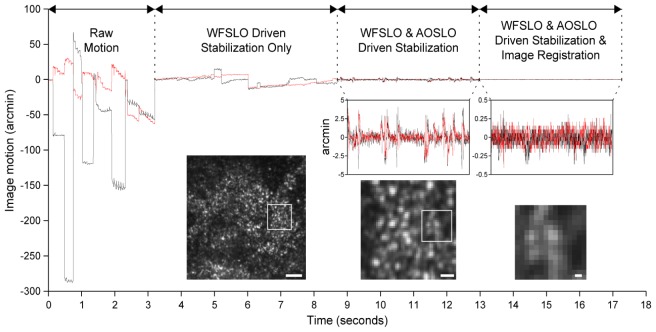
Fig. 9.
Each stage of motion compensation reduces the amplitude of residual motion. Note that each stage is shown running consecutively here for illustrative purposes but in practice all three stages run simultaneously. White squares in left image and center images denote areas of images shown to the right. Scale bars for the images are (from left to right): 25 µm, 5 µm, and 1 µm.

