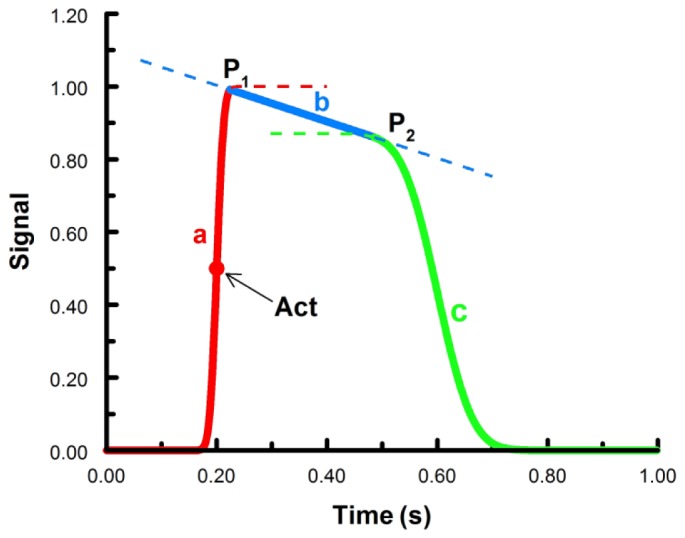
Fig. 1.

Functions to fit the cardiac action potentials. Curve a (red) and c (green) are cumulative normal distributions, line b (blue) is a linear function. P1 and P2 are junction points connecting the three functions. Together, the solid lines for a, b, and c comprise the fitted action potential. The red dot is the time of activation (arrow), which is 50% of the maximum value of the first cumulative normal. Act – activation time.
