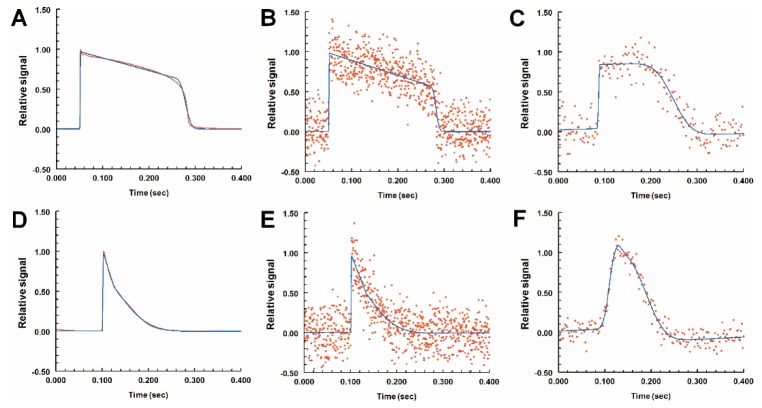
Fig. 2.
Least squares optimization to fit cardiac action potential curves. Red lines are noise-free action potentials of adult ventricular cells (A) or atrial cells (D). Red dots (B and E) are computer-generated signals based on the noise-free traces from A and D respectively with Gaussian-distributed noise to simulate OM recordings (sampling frequency 2000 Hz, SNR 4.0). Panels C and F are actual recordings from a stage-15 quail heart, at the ventricle and atrium respectively. The signals are displayed as relative fluorescence for comparison purposes. The blue lines (A-F) are the fit lines using the function described in Fig. 1. The added noise did not significantly alter the fit (blue lines, A vs. B, or D vs. E).

