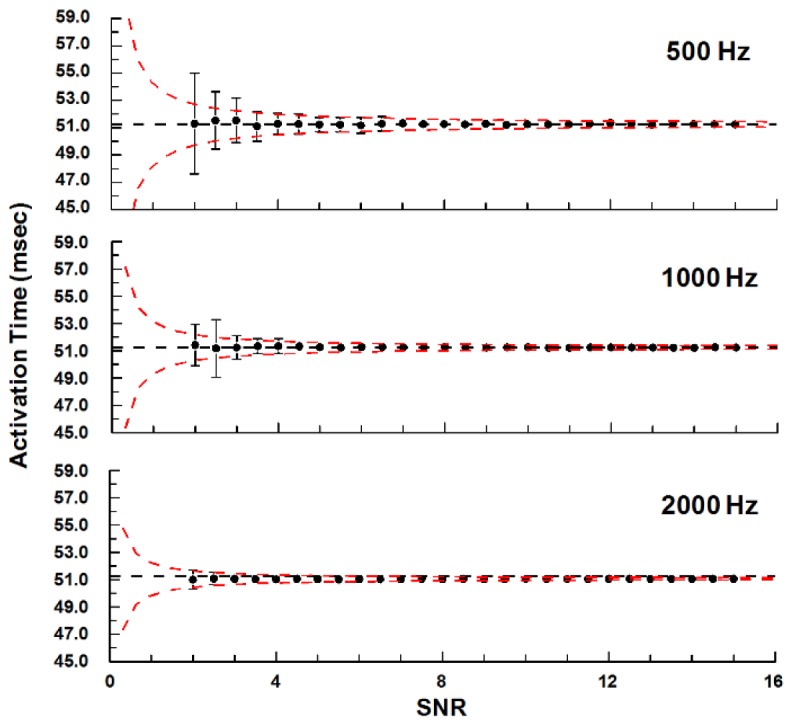
Fig. 3.

The fit method was accurate for a wide range of SNRs and sampling frequencies. The gold-standard activation time was determined from the noise-free model of a ventricular action potential (Fig. 2(A)) and plotted as the dashed lines. Each dot represents the average of 100 simulations with different random noise patterns, and the error bars are standard deviations. Simulations were performed at SNR levels between 2 and 15 with sampling frequencies of 500, 1000, or 2000 Hz (5k and 10k Hz were omitted from the plot). The red dashed lines are predictions of the fit precision based on power-law equations using the standard deviations from SNRs of 4-15.
