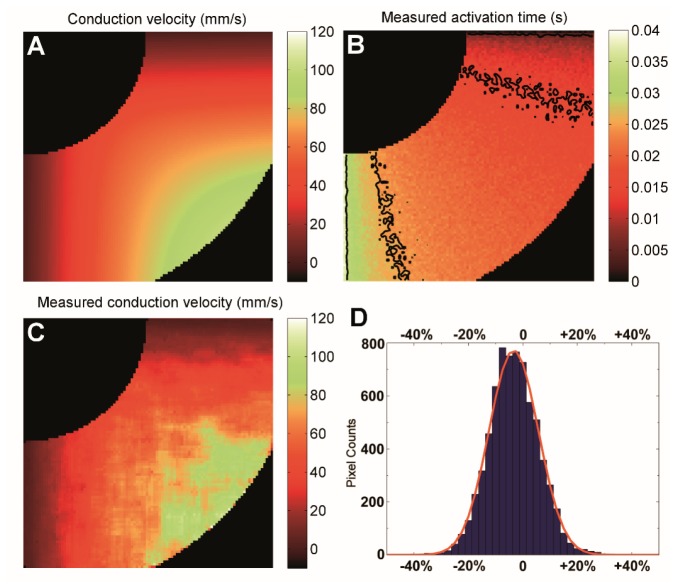
Fig. 5.
The heart-like digital phantom. The phantom was bordered by two concentric circles with a width of about 0.42 mm. The conduction was from the upper right corner to the lower left corner with a velocity ranging from 1 to 100 mm/s. (A) Preset conduction velocity, (B) Measured activation time with noise added to simulate an SNR of 4 (isochrone lines representing 10 ms spacing without spatial averaging to reflect the influence of noise), (C) Measured conduction velocity, and (D) Histogram of the bias, the red solid line was the fit to a Gaussian distribution.

