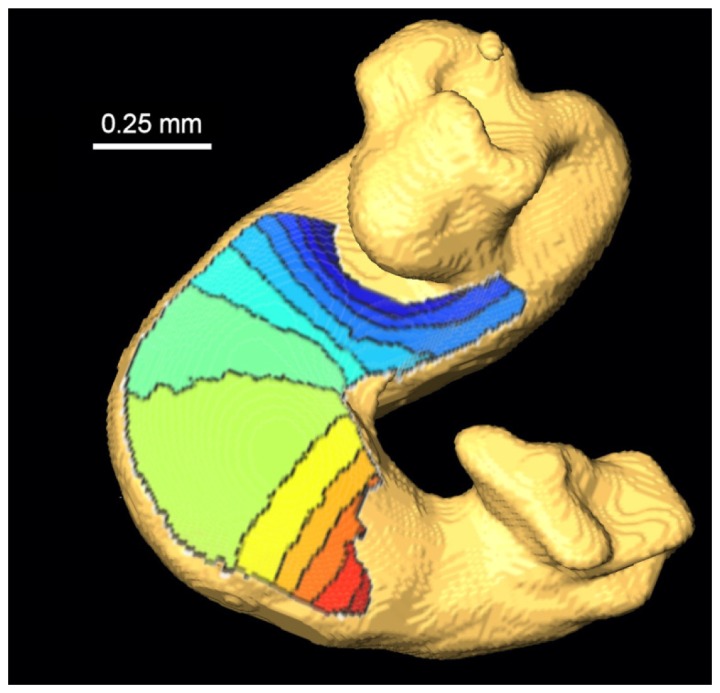
Fig. 6.

Activation isochrone map of a HH-15 quail embryonic heart. The conduction propagated from blue to red (early to late), with each line representing a 10-ms interval. The plot is the result of the average of 9 consecutive heart beats. The isochrone map was projected on the surface of an OCT volume representing the tubular heart. Regions around the atrium and outflow tract were removed from display due to increased noise levels caused by being out-of-focus.
