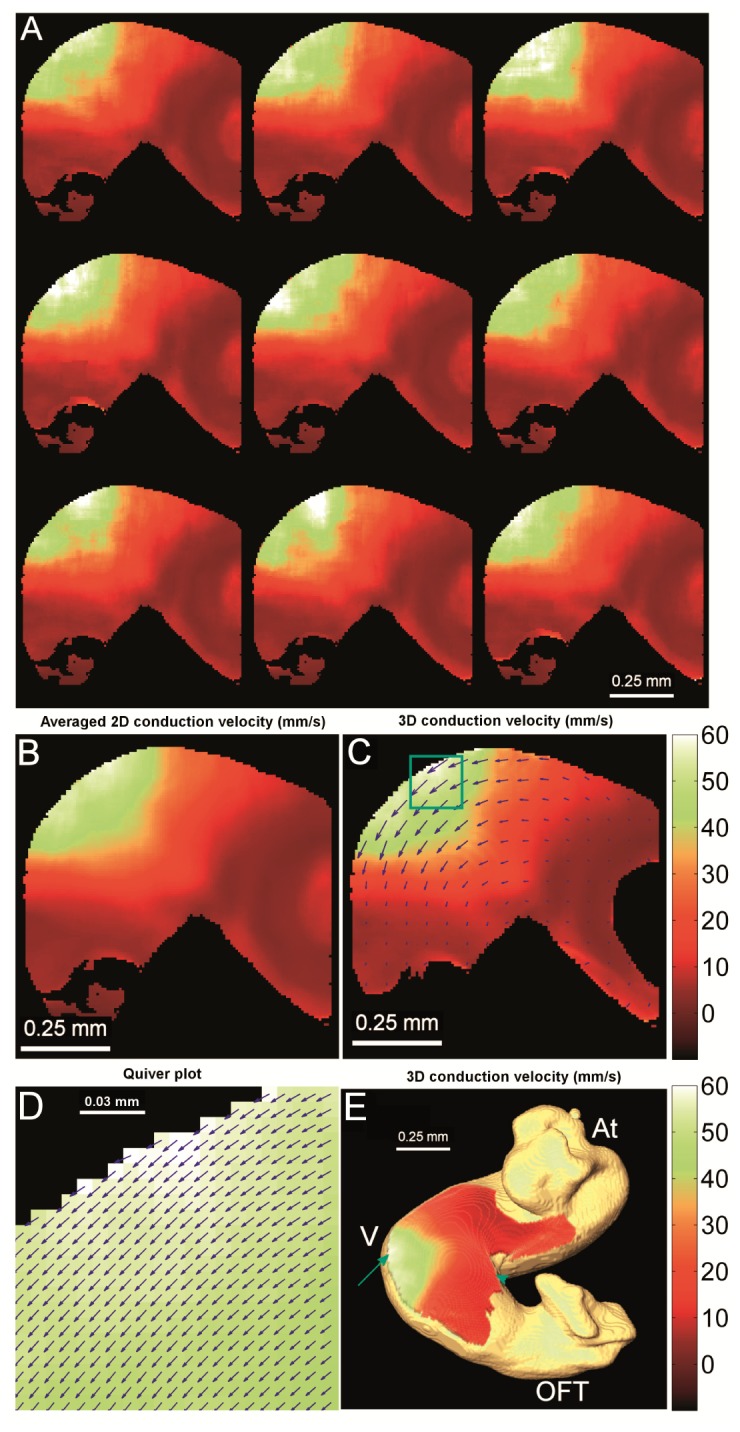
Fig. 7.

Conduction velocity map of a HH-stage 15 quail heart. (A) Conduction velocity maps calculated from each individual heartbeat, showing consistent conduction velocity patterns. (B) Averaged conduction velocity from all 9 heartbeats. (C) 3D corrected conduction velocity based on the 3D structure obtained from OCT. A quiver plot indicates the direction of conduction, and the length of the quiver was proportional to the 3D corrected conduction velocity. To make the quivers visible, only every eighth pixel horizontally and vertically was displayed. (D) The enlarged view of the quiver plot on every pixel inside of the green box in (C) showed consistent quiver directions. (E) 3D corrected conduction velocity map, projected on the 3D surface of the heart. The colorbars are in mm/s and represent the conduction velocity for all the panels. At – Atrium, V – Ventricle, OFT – outflow tract, red arrow – outer curvature of the ventricle, and blue arrowhead – inner curvature of the ventricle.
