Abstract
Background
This study aimed to investigate the relationship between miR-506 and proliferation and migration of breast cancer cells.
Material/Methods
MiR-506 mimics, inhibitor, and negative control (NC) were transfected into MDA-MB-231 breast cancer cells. Cell proliferation, cell counting, colony formation assay, and Transwell assay were applied to evaluate the proliferation and migration of breast cancer cells. Data are shown as mean ± standard deviation and the experiment was performed 3 times. Statistical analyses were performed with SPSS version 10.0.
Results
At 1 day after transfection, cell proliferation detected by CCK-8 assay was significantly promoted in miR-506 inhibitor when compared with the miR-506 mimics group and the NC group (P<0.05). At 3 days or 5 days after transfection, cell proliferation was markedly inhibited in the miR-506 mimics group, and miR-506 inhibitor was still significantly promoted. Cell counting with a hemocytometer showed similar results to cell proliferation. Colony formation assay showed that the number of colonies in the miR-506 mimics group was significantly smaller than that in the miR-506 inhibitor group and NC group. Transwell assay revealed that the number of migrated cells in miR-506 mimics was markedly smaller than that in the miR-506 inhibitor group and NC group.
Conclusions
MiR-506 over-expression significantly inhibits the proliferation, colony formation, and migration of breast cancer cells. miR-506 over-expression may thus be able to improve the malignant phenotype of breast cancer cells.
Keywords: Breast Neoplasms, Cell Proliferation, MicroRNAs, Neoplasm Metastasis
Background
Micro-RNAs (miRNAs) are endogenous non-encoding RNAs (ncRNA), usually composed of 20–25 amino acids. MiRNAs function via base-pairing with complementary sequences within mRNA molecules, which promote the mRNA degradation of target genes, or post-transcriptional inhibition to regulate or inhibit the translation of target genes [1,2]. Studies have confirmed that miRNAs are implicated in a series of pathological and physiological processes, including cell development, proliferation, differentiation, apoptosis, inflammation, and tumorigenesis [1].
Breast cancer is one of the most common malignancies in women worldwide. In the past decades, the therapeutic strategies for breast cancer have been significantly improved, and the survival of breast cancer patients has also improved markedly. However, breast cancer is still the second leading cause of cancer related death [3,4]. Thus, increasing numbers of studies are being conducted to identify molecular markers for early diagnosis of breast cancer. It has been reported that serum soluble E-cad level is an independent prognostic factor in Asian breast cancer patients [5]. Studies have shown that miR-506 plays an important role in melanoma [6] and lung cancer [7]. The effects of miRNAs on target genes are tissue- and time-specific. Thus, the present study was conducted to investigate the relationship between miR-506 and the proliferation and migration of breast cancer cells.
Material and Methods
Cell culture
MDA-MB-231 cells were highly invasive breast cancer cell lines of the NCI-60 panel of cancer cell lines. MDA-MB-231 breast cancer cells were purchased from Cell Bank of Shanghai Chinese Academy of Sciences and maintained in medium containing 10% fetal bovine serum (FBS, Gibco Co., Ltd. U.S.A.) in an environment with 5% CO2 at 37°C.
Synthesis of miR-506 mimics and inhibitor
Syntheses of miR-506 mimics, inhibitor, and negative control (NC) were performed by Shanghai Genepharma Biotech Co., Ltd. In the NC group, cells were transfected with empty vectors. The sequencing was performed by Shanghai Sunny Biotech Co., Ltd. And the nucleotide sequences of miR-506 mimics and inhibitor were as follows: MiR-506 mimics: UAAGGCACCCUUCUGAGUAGAUACUCAGAAGGGUGCCUUAUU; MiR-506 inhibitor: UCUACUCAGAAGGGUGCCUUA
Transfection of MDA-MB-231 breast cancer cells with miR-506 mimics/inhibitor/NC
MDA-MB-231 cells were passaged. Cells of the 4th generation were used for transfection. Before transfection, cells were digested with 0.25% trypsin (Shanghai Jierui Biotech Co., Ltd.) and washed in PBS (Shanghai Shenggong Bioengineering Co., Ltd., 1106406Z). Then, these cells were seeded into 3 six-well plates (3×10⁵ cells/well, Coring Co., Ltd. U.S.A.), and maintained in 2 ml of medium containing 10% FBS at 37°C in an environment with 5% CO2. When cell confluence reached about 70%, cells were transferred into serum-free OPTI-MEM (150 μL/well, Coring Co., Ltd. U.S.A.), followed by transfection 1 h later. Preparation of liposome complexes for transfection was as follows: 50 ng of miR-506 mimics (inhibitor or NC) was added to 200 μl of serum-free OPTI-MEM; 10 μL of Lipofectamine™ 2000 (Invitrogen Co., Ltd. U.S.A., 11668019) was added to 200 μl of serum-free OPTI-MEM. Solution A (Plasmid Mini Kit, Tiangen Biotech Co., Ltd., DP103-02) was mixed with solution B (Plasmid Mini Kit, Tiangen Biotech Co., Ltd., DP103-02) and kept at room temperature for 20 min. The above mixture was added to the various dishes, which were gently shaken to completely mix complexes. Two wells were included for a specific nucleotide treatment, and 3 groups were included (miR-506 mimics, miR-506 inhibitor, and NC groups). The same reagent was prepared at the same time to minimize error in adding reagent. After incubation in an environment with 5% CO2 at 37°C for 4–6 h, the serum-free medium was removed, and cells were maintained in DMEM (Gibco Co., Ltd. U.S.A.) containing 10% FBS.
Detection of cell proliferation by CCK-8 assay
At 12–24 h after transfection, cells were digested with 0.25% trypsin for 2 min and a single-cell suspension was prepared, followed by cell counting with a hemocytometer. Cells were seeded into 96-well plates (100 μL/well; 4000 cells/well) and 9 wells were included in each group. Then, cells were incubated at 37°C in an environment with 5% CO2. At 1, 3, and 5 days, 10 μL of CCK-8 solution (Dojindo Co., Ltd. Japan) was added into each well, followed by incubation for 1–4 h, and the solution color was monitored. When the difference in the color was significant between groups, absorbance was measured at 450 nm. The experiment was done 3 times.
Cell counting
At 12–24 h after transfection, cells were digested with 0.25% trypsin for 2 min and a single-cell suspension was prepared, followed by cell counting with a hemocytometer. Cells were then seeded into 96-well plates (100 μL/well; 2000 cells/well). Cells were incubated at 37°C in an environment with 5% CO2. At 1, 3, and 5 days, cells were harvested by digestion with trypsin and then counted with a hemocytometer. The average was obtained.
Colony formation assay
At 12–24 h after transfection, cells were digested with 0.25% trypsin for 2 min and a single-cell suspension was prepared, followed by cell counting with a hemocytometer. Cells were then seeded into 6-well plates (3000 cells/well) and incubated at 37°C in an environment with 5% CO2 for 14 days. Then, the medium was refreshed with medium containing 10% FBS once every 2 days, and the colony formation was observed. Colonies with more than 40 cells were counted. Four fields were employed, and the mean was obtained. In addition, crystal violet staining (Shanghai Jingtian Biotech Co., Ltd., JT-00518) was applied and representative photographs were captured.
Transwell assay
Preparation of 1% BSA: 0.1 mg of fibrinogen was dissolved in 10 ml of DMEM, and the mixture was sterilized by filtering through a 0.22-μm filter and stored at –20°C. Cells were digested, centrifuged, and re-suspended in DMEM containing 0.1% BSA. Cells were seeded into the upper chamber of Transwell chambers (5×10⁴ cells; 200 μL, Coring Co., Ltd. U.S.A., 13311030).
Then, 500 μL of DMEM containing 10% FBS was added to the lower chamber, and small bubbles were avoided in the lower chamber. The Transwell chambers were incubated at 37°C in an environment with 5% CO2 for 16 h. The chambers were taken out and residual cells were removed. Then, swabs were used to remove the cells in the upper chamber. The chamber membrane was washed in PBS and fixed in 95% ethanol (Shanghai Guoyao Co., Ltd.) or absolute ethanol for 10 min, followed by air drying. The chamber membrane was stained with 0.1% crystal violet for 10 min and washed with flowing water 3 times. After air drying, representative photographs were captured. After photographing, the crystal violet on membrane was dissolved in 300 μL of 33% glacial acetic acid (Shanghai Guoyao Co., Ltd.) and absorbance was measured at 573 nm with a microplate reader.
Statistical analysis
Data are expressed as mean ± standard deviation, and the experiment was done 3 times. Statistical analyses were performed with SPSS version 10.0. The chi-square test was employed for comparisons. A value of P<0.05 was considered statistically significant.
Results
Cell proliferation determined by CCK-8 assay
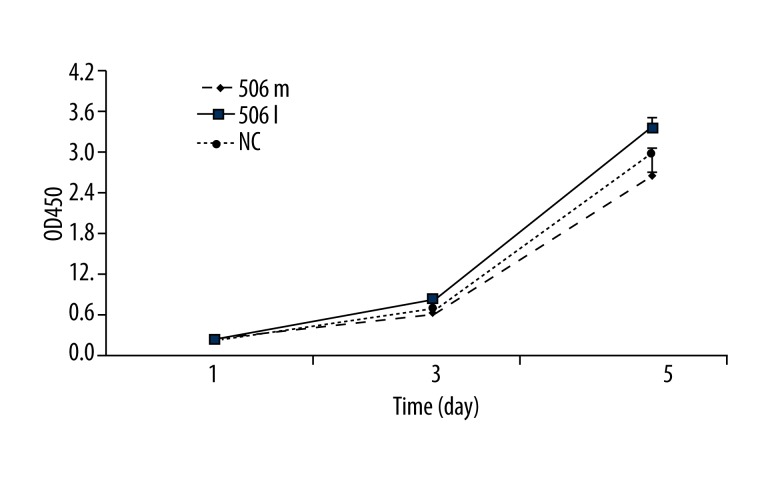
CCK-8 assay was used to detect cell proliferation. At 1 day after transfection, cell proliferation was significantly promoted in the miR-506 inhibitor group when compared with the miR-506 mimics group and NC group (P<0.05). However, there was no marked difference between miR-506 the mimics group and the NC group.
At 3 days after transfection, cell proliferation was markedly inhibited in the miR-506 mimics group, and that in the miR-506 inhibitor group was still significantly promoted. A significant difference was observed in the cell proliferation between 2 groups. Similar findings were observed at 5 days after transfection (Figure 1).
Figure 1.
Detection of cell proliferation by CCK-8 assay in the miR-506 mimics group, miR-506 inhibitor group, and NC group. 506m: miR-506 mimics; 506I: miR-506 inhibitor; NC: negative control.
Cell counting
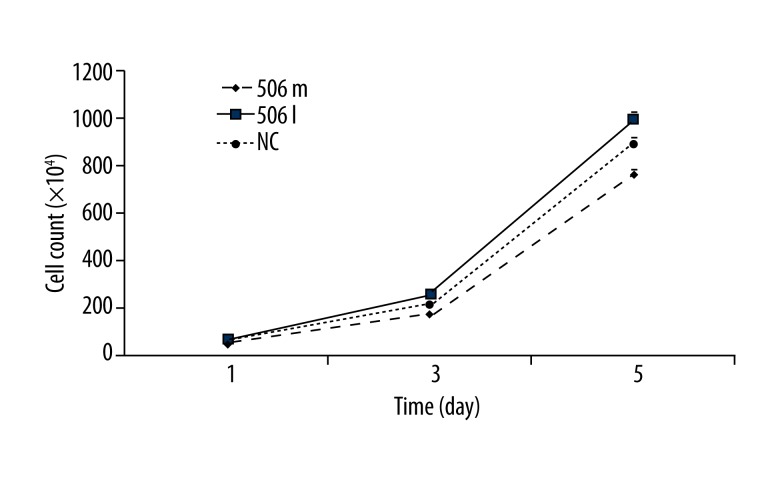
A hemocytometer was used in cell counting. Cell counting showed similar results to cell proliferation by CCK-8 assay. At 1 day after transfection, cell proliferation increased markedly in the miR-506 inhibitor group, but remained unchanged in miR-506 mimics group. At 3 days after transfection, cell proliferation was significantly inhibited in the miR-506 mimics group, but that in the miR-506 inhibitor group was still promoted when compared with the NC group. At 5 days after transfection, similar findings were observed as at day 3 (Figure 2).
Figure 2.
Detection of cell proliferation by cell counting in the miR-506 mimics group, miR-506 inhibitor group, and NC group. 506m: miR-506 mimics; 506I: miR-506 inhibitor; NC: negative control.
Colony formation assay
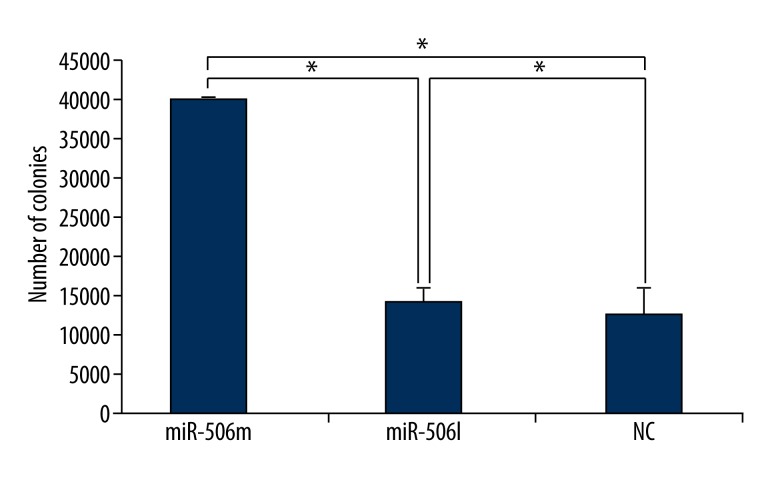
Crystal violet staining was used to detect cell colony formation. At 14 days after cell seeding, the colony formation was observed (Figures 3 and 4). Image J software was employed to count colonies. Results showed that the number of colonies in miR-506 mimics group was significantly smaller than that in the miR-506 inhibitor group and NC group (P<0.05). In addition, when compared with the NC group, more colonies were observed in the miR-506 inhibitor group. These findings suggested that miR-506 mimics inhibit colony formation, but that miR-506 inhibitor reversed this suppression.
Figure 3.

Colony formation assay of cells in the miR-506 mimics group, miR-506 inhibitor group, and NC group. (A) miR-506 inhibitor; (B) miR-506 mimics; (C) NC
Figure 4.
Colonies were counted with Image J software. MiR-506m: miR-506 mimics; miR-506I: miR-506 inhibitor; miR-374am: miR-374a mimics; miR-374a I: miR-374a inhibitor; miR-374bm: miR-374b mimics; miR-374b I: miR-374b inhibitor. * P<0.05
Transwell chamber assay
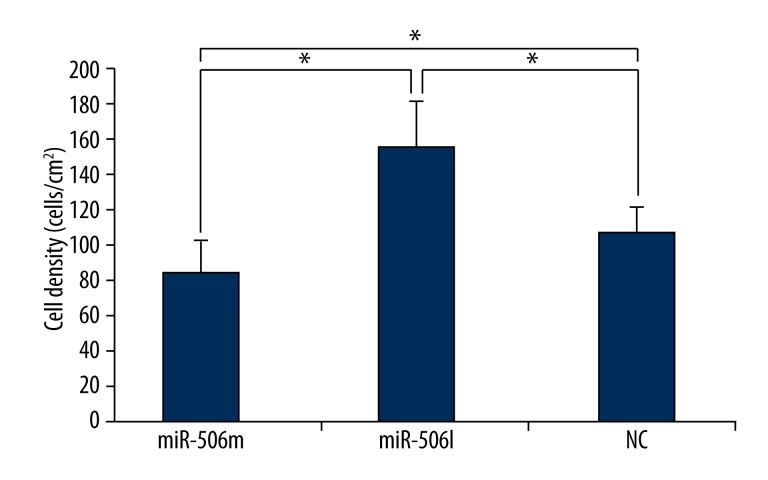
Transwell assay was used to detect cell density and migration. Cells were seeded into a Transwell chamber and then fixed 24 h later. Results showed the number of migrating cells in the miR-506 mimics group was smaller than that in the miR-506 inhibitor group and NC group. The number of cells on the lower surface was the smallest in the miR-506 mimics group and the highest in the miR-506 inhibitor group, suggesting that miR-506 inhibitor may reverse the micro-RNA induced inhibition. Image J software was used to determine the cell density. Results also revealed that the number of cells was smallest in the miR-506 mimics group and highest in the miR-506 inhibitor group (Figures 5 and 6).
Figure 5.

Transwell invasion assay of MDA-MB-231 cells in the miR-506 mimics group, miR-506 inhibitor group, and NC group. (A) NC; (B) miR-506 mimics; (C) miR-374a mimics.
Figure 6.
Detection of cell density with Image J software. MiR-506m: miR-506 mimics; miR-506I: miR-506 inhibitor. * P<0.05
Discussion
With the development of in-depth understanding of miRNA-induced post-transcriptional modulation, miRNAs have been a hot topic in studies on the occurrence, development, resistance, and prognosis of cancers [1]. Multiple miRNAs may be simultaneously expressed in a cell, and cells are thus usually in a miRNA enriched environment. In this environment, the mRNA expression of thousands of genes is controlled by miRNAs, which allow the expression of different proteins at appropriate levels. Bartel et al. compared miRNAs to miniature resistance and found they could exert different effects, from excising (100% inhibition) to slight inhibition, depending on the cell status [8]. Actually, there are more than 1000 miRNAs in the human genome [9]. It is estimated that miRNAs control the expression of about 1/2 of the genes in the human genome. Thus, miRNAs may become an important hot topic in studies on diseases, especially cancers [10].
The relationship between miRNAs and breast cancer has been studied. Weili Min reported that miR-145, miR-21, miR-10b, miR-125a, and miR-206 may play important roles in breast cancer development and invasion [11]. It is suggested that miR-200c may function as a tumor-suppressor gene in triple-negative breast cancer [12]. In most cancers, including breast cancer, miR-21 was highly expressed [13,14]. Besides, research on miR-34b/34c and miR-206 provided evidence of associations with breast cancer survival [15]. By meta-analysis, miR-34b/c rs4938723 polymorphism was found to be closely related to cancer susceptibility in Asians when compared with African-Americans and Caucasians [16].
MiR-506 is mapped to chromosome X. To date, few studies have been conducted to investigate miR-506, and its roles in the occurrence and development of malignant tumors are thus still poorly understood. Streicher et al. found that high miR-506 expression was positively related to the degree of malignancy of melanoma, and that inhibition of miR-506 expression could significantly suppress the proliferation of melanoma cells, induce their apoptosis, and compromise their invasiveness and colony formation ability [6]. Yao et al. investigated the role of miR-506 in anti-BPDE-induced lung cancer. Their results showed that miR-506 expression was reduced in anti-BPDE induced lung cancer and that miR-506 could inhibit the expression of N-Ras, an oncogene. Thus, miR-506 may act as a tumor suppressor gene in the environment of lung cancer through the inhibition of N-Ras expression [7]. However, Jin et al. found that miR-506 could induce the resistance of rectal cancer cells to hydroxy camptothecin (HCPT) via inhibiting PPARα expression [17]. We speculated that the discrepancy in the role of miR-506 in cancers may be due to temporal and spatial specificity.
The relationship between miR-506 and breast cancer was poorly studied in few references. In 2009, it was reported that 3 microRNAs (miR-143, miR-506, and miR-98) showed similar E2-dependent regulation in 2 breast cancer cell types: MCF-7 cells with a retrovirus vector control (MCF-7p) and MCF-7 cells overexpressing constitutively active AKT1 (MCF-7AKT) [18]. In 2013, Arora reported that overexpression of miR-506 inhibited TGFβ-induced EMT and suppressed adhesion, invasion, and migration of MDA-MB-231 cells [19]. In 2015, screening of a miRNA library by functional proteomics in multiple cell lines and integration of data from breast and ovarian tumors revealed miR-124, miR-365, miR-34b*, miR-18a and miR-506 as potential tumor suppressors capable of reversing the p27/myc/phospho-Rb protein signature [20].
In the present study, miR-506 mimics and its inhibitor were synthesized and transfected into MDA-MB-231 breast cancer cells. The proliferation and migration of these cells were then investigated. Our results showed miR-506 mimics can effectively reduce the proliferation of breast cancer cells, reduce the colony formation ability, and inhibit their invasion and migration. However, miR-506 inhibitor exerted reversed effects as compared to miR-506 mimics. MiR-506 inhibitor was able to increase the proliferation of breast cancer cells, promote colony formation, and elevate their invasion and migration. These findings suggest that miR-506 acts as a tumor suppressor gene in the proliferation and metastasis of breast cancer cells.
Conclusions
MiR-506 mimics and miR-506 inhibitor were independently transfected into MDA-MB-231 breast cancer cells to induce the over-expression and inhibition of miR-506. Our results demonstrate that miR-506 over-expression can significantly inhibit the proliferation, colony formation, invasion, and migration of breast cancer cells and that miR-506 may be able to inhibit the malignant phenotype of breast cancer cells.
Footnotes
Source of support: National Natural Science Foundation of China (81301993)
References
- 1.Bartel DP. MicroRNAs: target recognition and regulatory functions. Cell. 2009;136:215–33. doi: 10.1016/j.cell.2009.01.002. [DOI] [PMC free article] [PubMed] [Google Scholar]
- 2.Bohnsack MT, Czaplinski K, Gorlich D. Exportin 5 is a RanGTP-dependent dsRNA-binding protein that mediates nuclear export of pre-miRNAs. RNA. 2004;10:185–91. doi: 10.1261/rna.5167604. [DOI] [PMC free article] [PubMed] [Google Scholar]
- 3.Yu M, Bardia A, Aceto N, et al. Cancer therapy. Ex vivo culture of circulating breast tumor cells for individualized testing of drug susceptibility. Science. 2014;345:216–20. doi: 10.1126/science.1253533. [DOI] [PMC free article] [PubMed] [Google Scholar]
- 4.Aceto N, Bardia A, Miyamoto DT, et al. Circulating tumor cell clusters are oligoclonal precursors of breast cancer metastasis. Cell. 2014;158:1110–22. doi: 10.1016/j.cell.2014.07.013. [DOI] [PMC free article] [PubMed] [Google Scholar]
- 5.Liang Z, Sun XY, Xu LC, Fu RZ. Abnormal expression of serum soluble E-cadherin is correlated with clinicopathological features and prognosis of breast cancer. Med Sci Monit. 2014;20:2776–82. doi: 10.12659/MSM.892049. [DOI] [PMC free article] [PubMed] [Google Scholar]
- 6.Streicher KL, Zhu W, Lehmann KP, et al. A novel oncogenic role for the miRNA-506-514 cluster in initiating melanocyte transformation and promoting melanoma growth. Oncogene. 2012;31:1558–70. doi: 10.1038/onc.2011.345. [DOI] [PubMed] [Google Scholar]
- 7.Kulda V, Pesta M, Topolcan O, et al. Relevance of miR-21 and miR-143 expression in tissue samples of colorectal carcinoma and its liver metastases. Cancer Genet Cytogenet. 2010;200:154–60. doi: 10.1016/j.cancergencyto.2010.04.015. [DOI] [PubMed] [Google Scholar]
- 8.Bartel DP, Chen CZ. Micromanagers of gene expression: the potentially widespread influence of metazoan microRNAs. Nat Rev Genet. 2004;5:396–400. doi: 10.1038/nrg1328. [DOI] [PubMed] [Google Scholar]
- 9.Takada S, Mano H. Profiling of microRNA expression by mRAP. Nat Protoc. 2007;2:3136–45. doi: 10.1038/nprot.2007.457. [DOI] [PubMed] [Google Scholar]
- 10.Herai RR, Stefanacci L, Hrvoj-Mihic B, et al. Micro RNA detection in long-term fixed tissue of cortical glutamatergic pyramidal neurons after targeted laser-capture neuroanatomical microdissection. J Neurosci Methods. 2014;235:76–82. doi: 10.1016/j.jneumeth.2014.06.028. [DOI] [PMC free article] [PubMed] [Google Scholar]
- 11.Min W, Wang B, Li J, et al. The expression and significance of five types of miRNAs in breast cancer. Med Sci Monit Basic Res. 2014;20:97–104. doi: 10.12659/MSMBR.891246. [DOI] [PMC free article] [PubMed] [Google Scholar]
- 12.Ren Y, Han X, Yu K, et al. microRNA-200c downregulates XIAP expression to suppress proliferation and promote apoptosis of triple-negative breast cancer cells. Mol Med Rep. 2014;10:315–21. doi: 10.3892/mmr.2014.2222. [DOI] [PubMed] [Google Scholar]
- 13.Ma Y, Xia H, Liu Y. Silencing miR-21 sensitizes non-small cell lung cancer A549 cells to ionizing radiation through inhibition of PI3K/Akt. Biomed Res Int. 2014;2014:617868. doi: 10.1155/2014/617868. [DOI] [PMC free article] [PubMed] [Google Scholar]
- 14.Muller V, Gade S, Steinbach B, et al. Changes in serum levels of miR-21, miR-210, and miR-373 in HER2-positive breast cancer patients undergoing neoadjuvant therapy: a translational research project within the Geparquinto trial. Breast Cancer Res Treat. 2014;147:61–68. doi: 10.1007/s10549-014-3079-3. [DOI] [PubMed] [Google Scholar]
- 15.Bensen JT, Tse CK, Nyante SJ, et al. Association of germline microRNA SNPs in pre-miRNA flanking region and breast cancer risk and survival: the Carolina Breast Cancer Study. Cancer Causes Control. 2013;24:1099–109. doi: 10.1007/s10552-013-0187-z. [DOI] [PMC free article] [PubMed] [Google Scholar]
- 16.Wang X, Lu X, Fang Y, et al. Association between miR34b/c polymorphism rs4938723 and cancer risk: a meta-analysis of 11 studies including 6169 cases and 6337 controls. Med Sci Monit. 2014;20:1977–82. doi: 10.12659/MSM.892350. [DOI] [PMC free article] [PubMed] [Google Scholar]
- 17.Tong JL, Zhang CP, Nie F, et al. MicroRNA 506 regulates expression of PPAR alpha in hydroxycamptothecin-resistant human colon cancer cells. FEBS Lett. 2011;585:3560–68. doi: 10.1016/j.febslet.2011.10.021. [DOI] [PubMed] [Google Scholar]
- 18.Bhat-Nakshatri P, Wang G, Collins NR, et al. Estradiol-regulated microRNAs control estradiol response in breast cancer cells. Nucleic Acids Res. 2009;37:4850–61. doi: 10.1093/nar/gkp500. [DOI] [PMC free article] [PubMed] [Google Scholar]
- 19.Arora H, Qureshi R, Park WY. miR-506 regulates epithelial mesenchymal transition in breast cancer cell lines. PLoS One. 2013;8:e64273. doi: 10.1371/journal.pone.0064273. [DOI] [PMC free article] [PubMed] [Google Scholar]
- 20.Seviour EG, Sehgal V, Lu Y, et al. Functional proteomics identifies miRNAs to target a p27/Myc/phospho-Rb signature in breast and ovarian cancer. Oncogene. 2015 doi: 10.1038/onc.2014.469. [Epub ahead of print] [DOI] [PMC free article] [PubMed] [Google Scholar]


