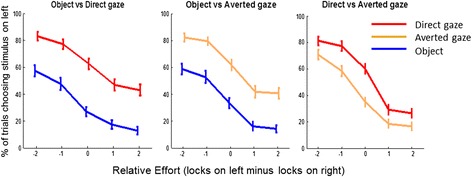
Fig. 2.

Choices according to effort and stimuli. Each plot shows how often (%) the participant chose the left box for a particular level of effort. The coloured lines indicate which stimulus category was in the left box on each trial. For example, in the left-hand plot, the red line above the blue line indicates participants preferred direct gaze videos
