
Fig. 3.
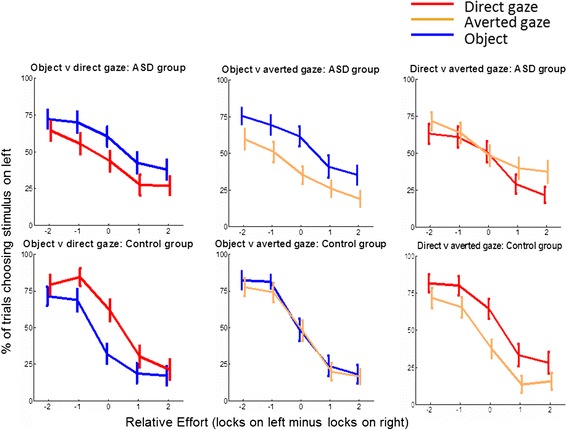
Choices in participants with (top row) and without (bottom row) autism. As in Fig. 2, the x axis represents effort and the lines show how often participants chose to view the movie on the left, for direct gaze (red), averted gaze (orange) and object (blue) movies