Figure 1.

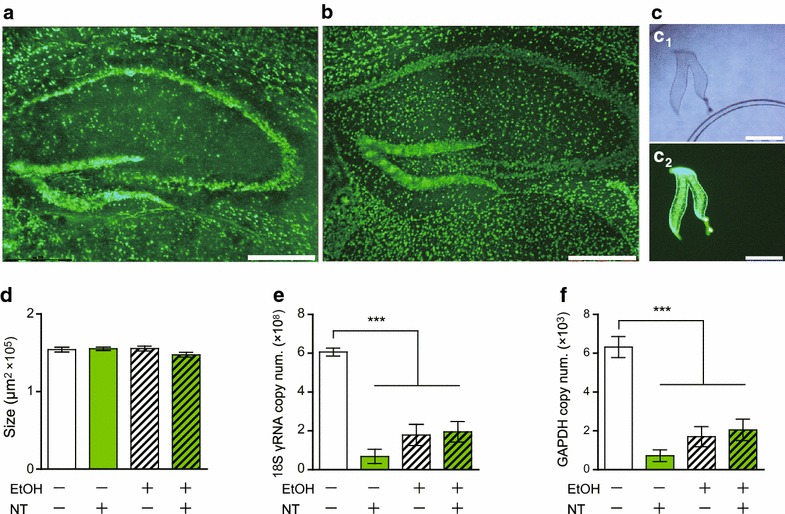
Visualization of neurons under a fluorescence radiated field, of a mouse hippocampus stained with NeuroTrace a without fixation and b with ethanol fixation. c A single dentate gyrus (DG) was collected, d 150,000 μm2 × 20 μm in volume, for the following each experimental condition: unfixed and unstained, NeuroTrace stained without ethanol fixation, ethanol fixation without staining, and ethanol (EtOH) and NeuroTrace (NT) treated. Transcript levels of e 18S rRNA and f GAPDH mRNA. Values are expressed as copy number of transcripts. Bars indicate mean ± SEM (n = 6 each). One-way ANOVA followed by Tukey post hoc test. *p < 0.05, **p < 0.01, ***p < 0.001. Scale bars 310 μm.
