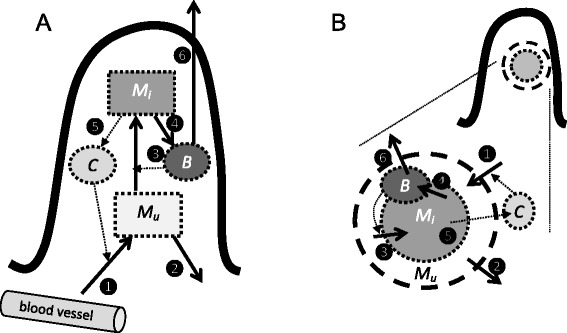
Figure 1.

Sketch of the villus and granuloma models. In both models, M u is the number of uninfected macrophages, M i is the number of infected macrophages, B is the number of free bacteria, and C is the amount of cytokines. The processes in both models are (1) inflow of uninfected macrophages, both normal “background” inflow and additional recruitment proportional to the amount of cytokines; (2) outflow of uninfected macrophages; (3) infection of uninfected macrophages by free bacteria; (4) bursting of infected macrophages and release of free bacteria; (5) outflow of cytokines produced by infected macrophages; (6) outflow of free bacteria resulting in phagocytosis and excretion. All rates are density-dependent. In the villus model (A) the volume remains constant and the densities are proportional to the numbers of cells and amount of cytokines. In the granuloma model (B) the density of macrophages remains constant and the volume is determined by the number of macrophages; the densities are equal to the numbers of cells and amount of cytokines divided by the granuloma volume; some rates are proportional to the surface area (1, 2, 5, 6).
