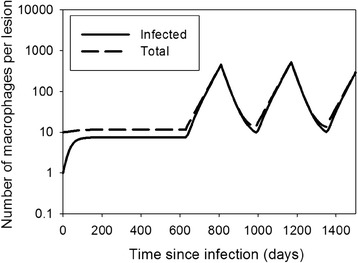
Figure 3.

MAP intermittent shedding dynamics with the villus model. Simulations with the villus model (Equation 2), with parameter values d = 0.04, M u 0 = 10, b = 0.04, R MAP = 2.5. The parameter R MF = 0.2 before day 630, between days 810 and 990, and between days 1170–1350, otherwise R MF = 1.5. This reflects a cow with yearly calving and higher R MF three months before and three months after calving.
