
Figure 2.
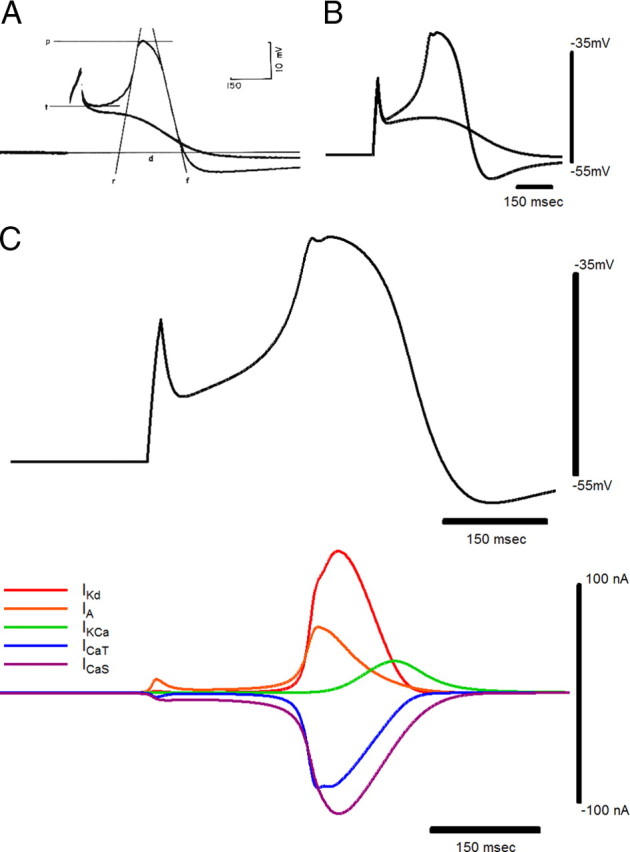
The driver potential response. Comparison of driver potential (p, peak; d, duration; t, threshold; r, line tangent to the maximum rate of rise; f, line tangent to the maximum rate of fall) and subthreshold responses in an anterior large cell of Portunus (A) (Tazaki and Cooke, 1979b) with those in the large-cell model (B). Current pulses in the model: DP, 20 nA, 20 ms. Subthreshold, 17 nA, 20 ms. C, Currents in the large-cell soma model during a driver potential.