
Figure 3.
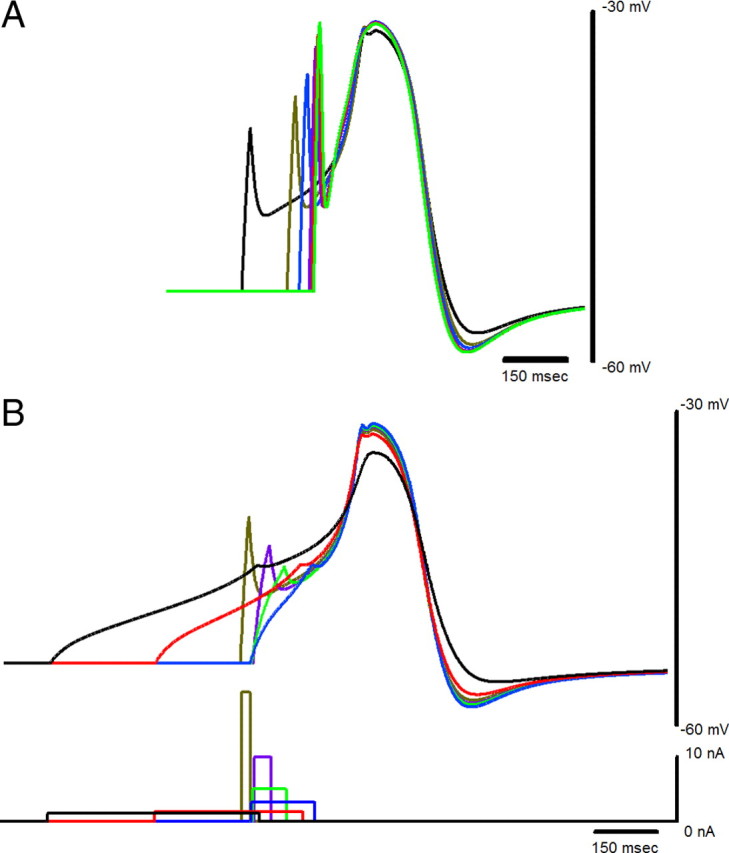
Driver potential form in the canonical large-cell model did not change significantly for different stimulus amplitudes or durations. A, Driver potential responses to 20 ms current injections ranging from 20 to 50 nA at 5 nA steps are overlaid with their peak voltages aligned. Longer latencies to the peak voltage correspond to weaker current injections. The trace with the lowest peak and least hyperpolarized afterpotential corresponds to a stimulus of 20 nA, which was just above threshold for a 20 ms current pulse. B, Driver potential responses (top) to current pulses (bottom) of varying duration with sufficient amplitudes to evoke full responses. Identical colors have been used for the stimulus and the corresponding membrane potential response.