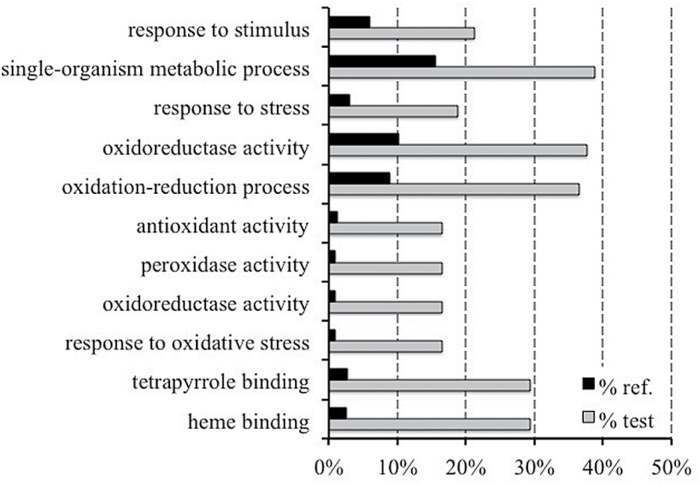
Fig. 3.
Identification of over-represented GO terms in the DEG set (FDR≤0.05) by enrichment analysis (Blast2GO). The graph represents the percentage of annotated GO (‘biological process’ and ‘molecular function’) categories of the identified data set that were found to be significantly enriched (FDR≤0.05).

