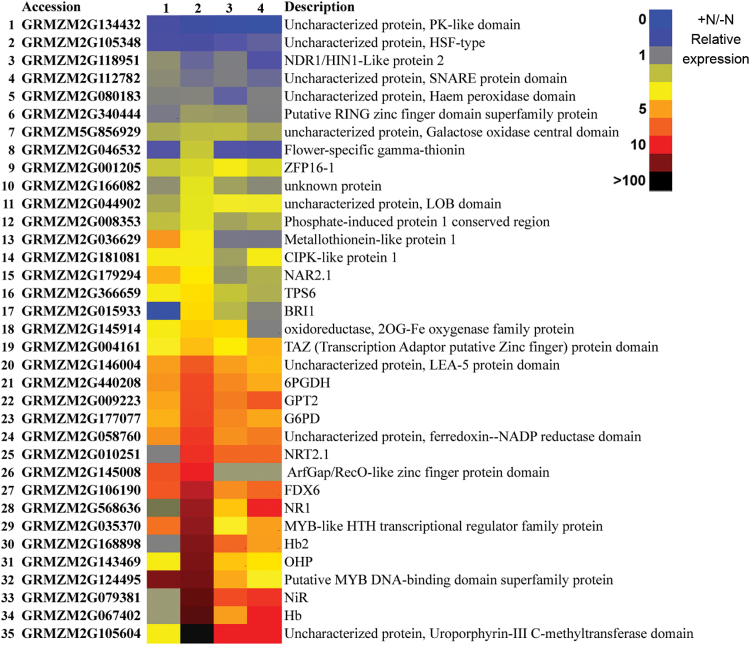
Fig. 6.
Heat map representation of qRT-PCR of differential relative expression of 35 selected DEGs in four sections (1, meristem-enriched zone; 2, TZ-enriched portion; 3, elongation zone-enriched portion; 4, maturation zone-enriched portion) of primary root seedlings. Analysis was conducted using five independent repetitions. The expression levels were normalized against the maize MEP gene and expression in the –N TZ samples was set as 1 using the 2–ΔΔC T method. Data for each region are reported as +N/–N qRT-PCR relative expression values. The colour bar indicates high to low expression. The responsive transcripts, together with an identifying number (1–35), are listed on the left of panel, and the function description on the right. (This figure is available in colour at JXB online.)

