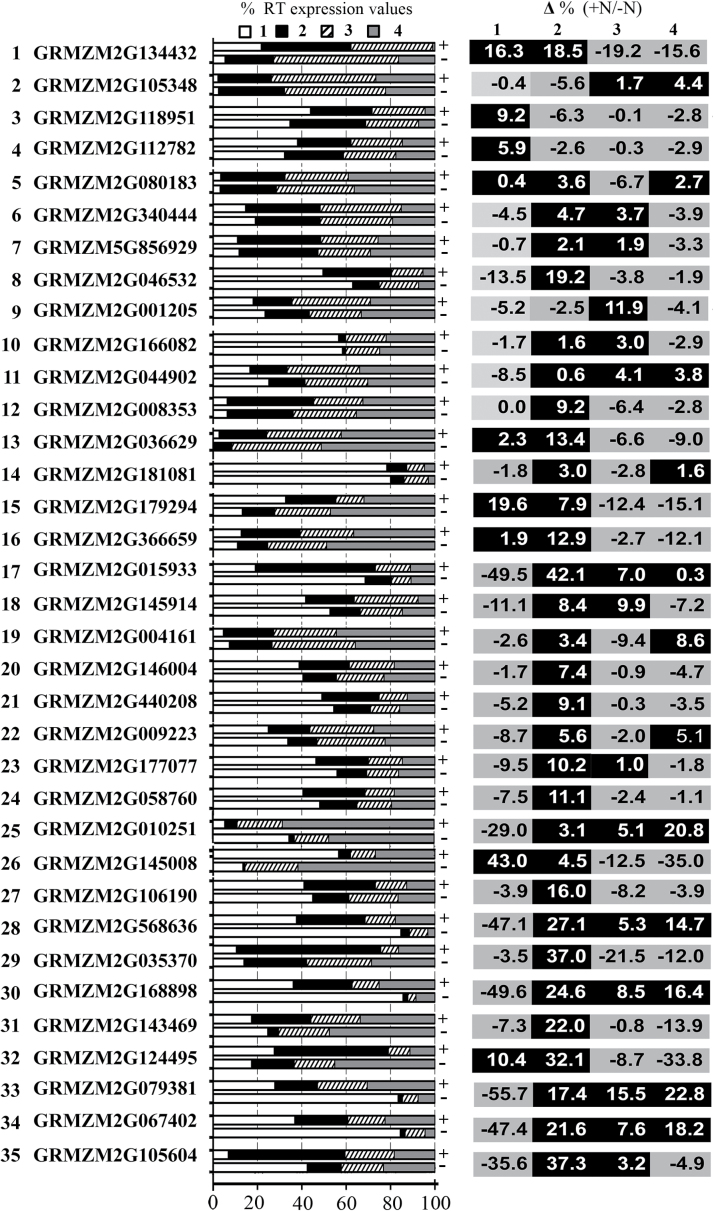
Fig. 7.
Percentage of transcript distribution in the four different root portions in nitrate-depleted (–N) and in nitrate-supplied (+N) root. Transcript abundance (%) of the 35 selected transcripts recorded in response to 2h of nitrate supply (+N) or depletion (–N) in each of the four primary root portions (1, meristem-enriched zone; 2, TZ-enriched portion; 3, elongation zone-enriched portion; 4, maturation zone-enriched portion) is shown in the left panel. The right panel shows the increase or decrease (%) in relative transcript abundance obtained by deducing –N (%) to +N (%) values described in the left panel.

