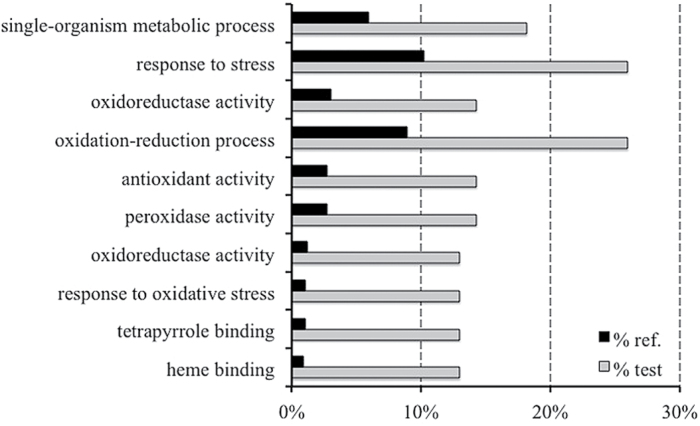
Fig. 9.
GO term enrichment analysis on proteome data obtained from iTRAQ analysis (Blast2GO software). The GO terms of ‘biological process’ and ‘molecular function’ were analysed, and significantly enriched categories (when compared with the entire proteome) (FDR≤0.05) were recorded. The percentage of over-represented GO terms among the iTRAQ differentially expressed proteins identified from the comparison between the TZ-enriched portion of seedlings grown in nitrate-supplied or -depleted solution are shown. Bars in grey indicate GO terms that were upregulated in the nitrate-supplied tissue versus the corresponding control (black bars).

