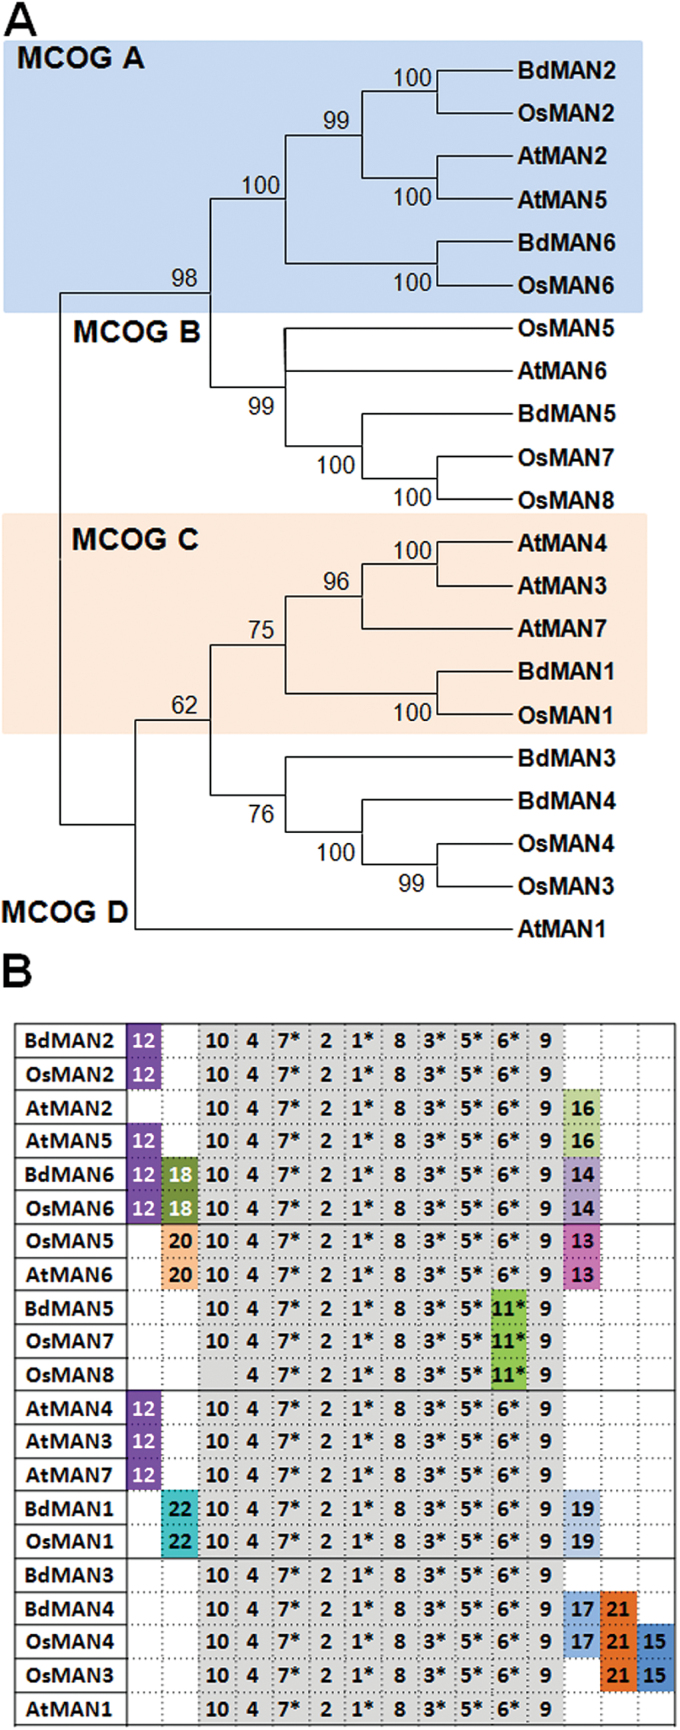
Fig. 3.
(A) Phylogenetic dendrogram with deduced protein sequence of the mannanase gene families form Brachypodium distachyon, Oryza sativa and Arabidopsis thaliana; bootstrapping values are indicated in the branches. (B) Schematic distribution of conserved motifs among the deduced protein sequences in the phylogenetic tree (A), identified by means of the MEME analysis. Asterisks indicate those motifs important for enzymatic activity. Motifs in grey share >85% of similar amino acid residues. This figure is available in colour at JXB online.

