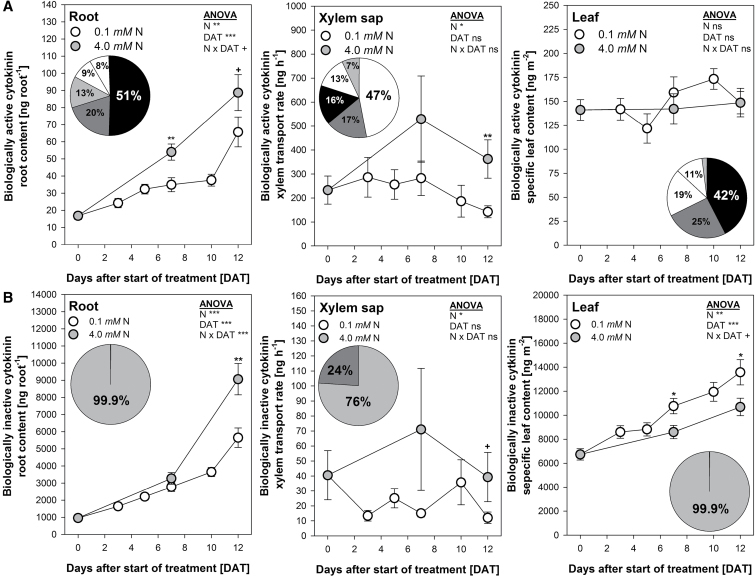
Fig. 4.
(A) Biologically active cytokinins (tZ, iP, DHZ, cZ, tZR) and (B) biologically inactive but activatable cytokinins (tZOR, tZORG) in the root, the xylem sap and the second oldest harvested mature leaf of the winter oilseed rape cultivars NPZ-1, NPZ-2, Apex and Capitol grown in hydroponics during 12 d N starvation (0.1mM) or optimal N supply (4.0mM). The plants were pre-cultured for 28 d at 2.0mM N. Pie chart in A: tZ (black), DHZ (dark grey), tZR (grey), cZ (white), iP (hatched). Pie chart in B: tZOG (grey), tZROG (dark grey). ANOVA: +, *, **, *** indicate significant differences at P<0.10, P<0.05, P<0.01, P<0.001, respectively; ns, non-significant. At 7 and 12 DAT: +, *, ** indicate differences between the N supplies at P<0.10, P<0.05, P<0.01, respectively. The error bars (visible only when greater than the symbols) represent the standard errors of the means across the four cultivars (n=3–4).

