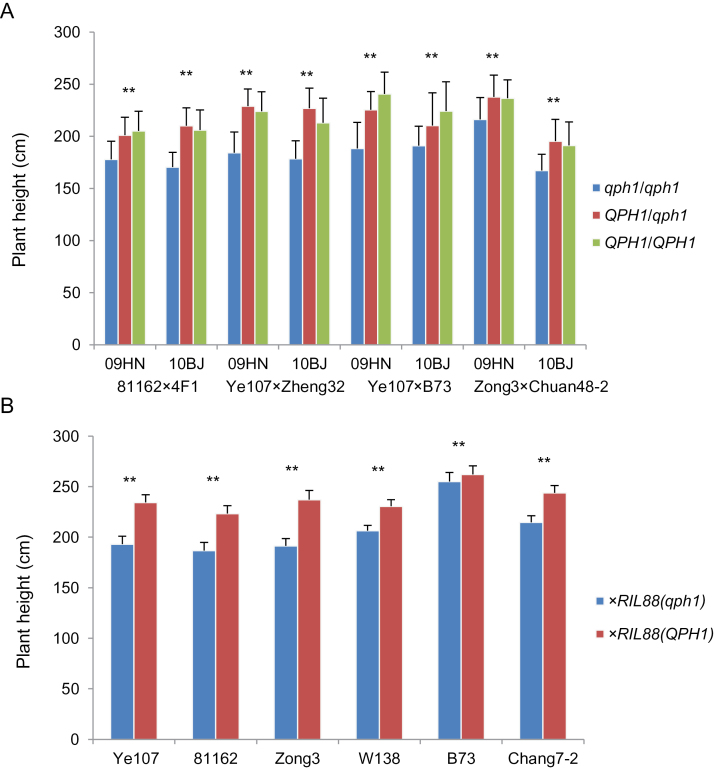
Fig. 7.
Plant height analysis of the four F2 populations and six pairs of single-cross hybrids. (A) Blue, red, and green represent the plant height of the qph1/qph1, QPH1/qph1, and QPH1/QPH1 individuals, respectively. Phenotype data were collected from two replicates in Hainan (2009, left) and Beijing (2010, right). 50, 100, and 50 individuals of qph1/qph1, QPH1/qph1, and QPH1/QPH1 were planted and analysed, respectively, for each population. (B) Plant height of RIL88(qph1) (blue) and RIL88(QPH1) (red) derived single-cross hybrids; 30–40 individuals were planted and analysed, respectively, in each genotype class, and data was collected from two replicates for each hybrid. **, significant difference (0.01 level). Data are expressed as mean ± SD.

