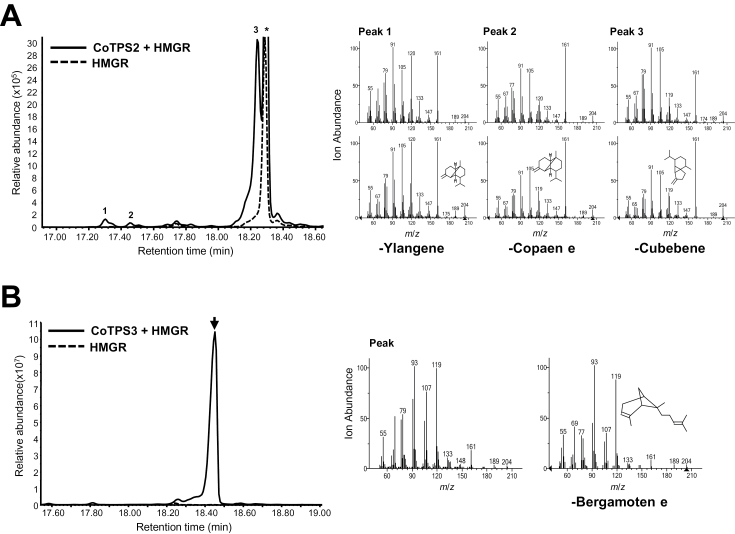
Fig. 8.
In vivo characterization of CoTPS2 and CoTPS3. YFP-fused CoTPS2 (A) or CoTPS3 (B) with or without HMGR was transiently expressed in N. benthamiana leaves by Agrobacterium-mediated infiltration. The compounds were analysed at 3 d post-infiltration by GC-MS. Numbered peaks or an arrow in the GC traces were identified by the mass spectra reference library, and the mass spectra of compounds are shown on the right side. The expression of HMGR alone in each figure was used as a control. The asterisk indicates a non-specific peak derived from the expression of HMGR in N. benthamiana leaves. m/z, Mass-to-charge ratio.

