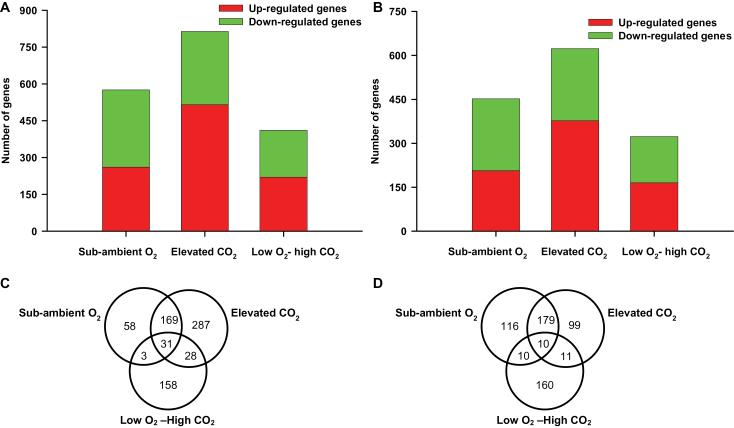
Fig. 1.
Microarray analysis of the number of genes whose expression are affected in P. patens gametophytes following a 7-day exposure to sub-ambient O2 (13%), elevated CO2 (1500 ppmV), and low O2–high CO2 compared to ambient CO2 and O2 level. (A) The number of transcripts exhibiting significant changes, relative to control ambient conditions (fold change ≥ 2; P ≤ 0.05, red and green indicates number of up- or down-regulated genes respectively) are indicated. (B) Numbers of P. patens transcripts homologous to Arabidopsis genes are indicated. (C) Venn diagram showing the number of P. patens genes commonly or exclusively up-regulated and (D) down-regulated in response to elevated CO2 (1500 ppmV), sub-ambient O2 (13%), and low O2–high CO2 compared to control ambient environment.

