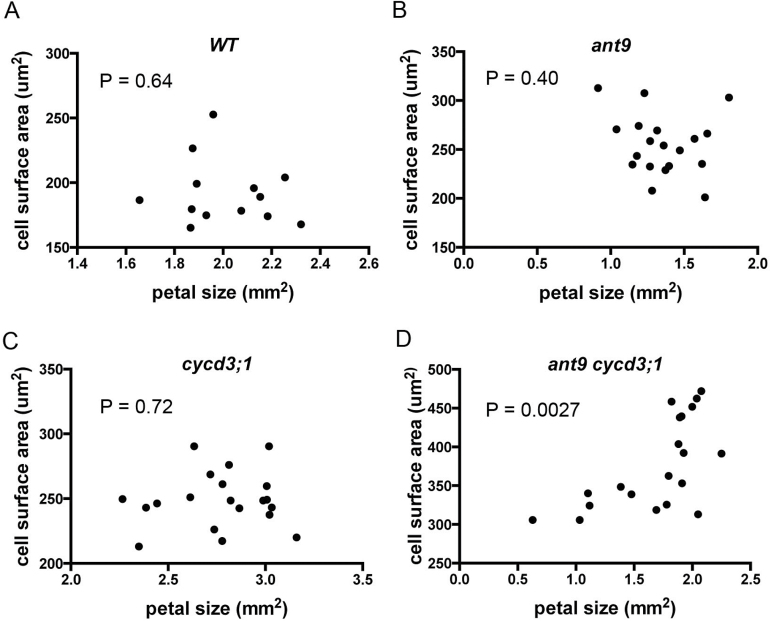
Fig. 2.
Petal size is correlated with cell size in ant-9 cycd3;1 double mutants. Each point represents the average adaxial epidermal cell size (y-axis) of a particular petal, the size of which it is plotted on the x-axis. Thirteen pairs of data are shown for the WT (top left), 19 for ant-9, 20 for cycd3;1, and 20 for the ant-9 cycd3;1 Ler double mutant.

