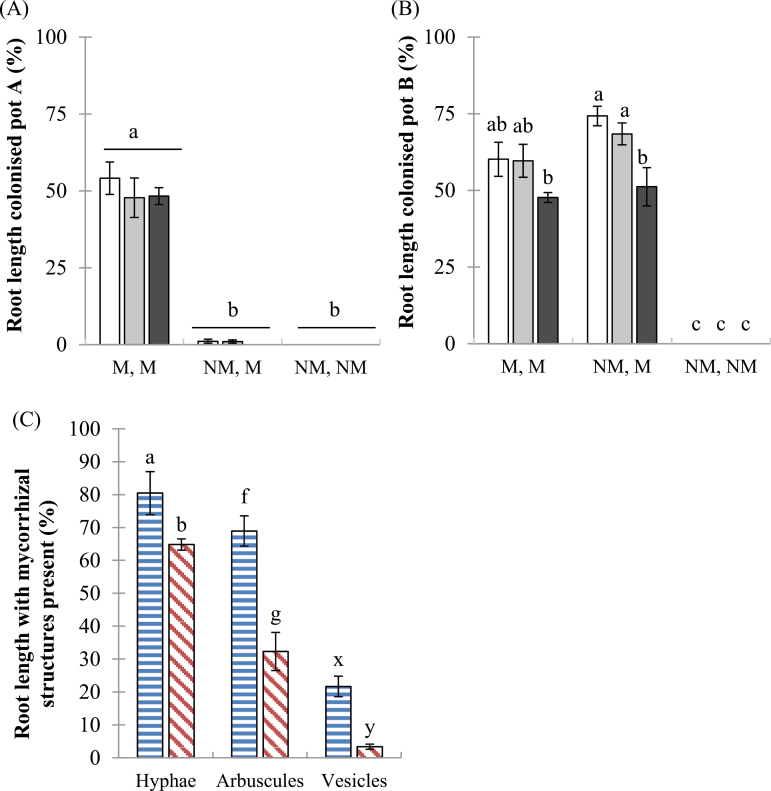
Fig. 2.
Mycorrhizal colonization in wild-type and mtpt4 roots. Root length colonized (%) in the wild-type genotype in (A) pot A and (B) pot B, at three soil P additions: 0 (white bars), 20 (grey bars), and 50 (black bars) mg P kg–1. Values are the mean ±standard error, n=5. Means followed by the same letter were not significantly different at the P<0.05 level (Tukey’s HSD). (C) Presence of different mycorrhizal structures (hyphae, arbuscules, and vesicles) within roots grown at P20 in pot B of NM,M pots only. Wild type, horizontal bars; mtpt4 mutant, diagonal bars. For (C) a different set of letters (ab, fg, xy) indicated a significant difference (at the P<0.05 level, Student’s t-test) between genotypes, for each type of colonization separately. (This figure is available in colour at JXB online.)

