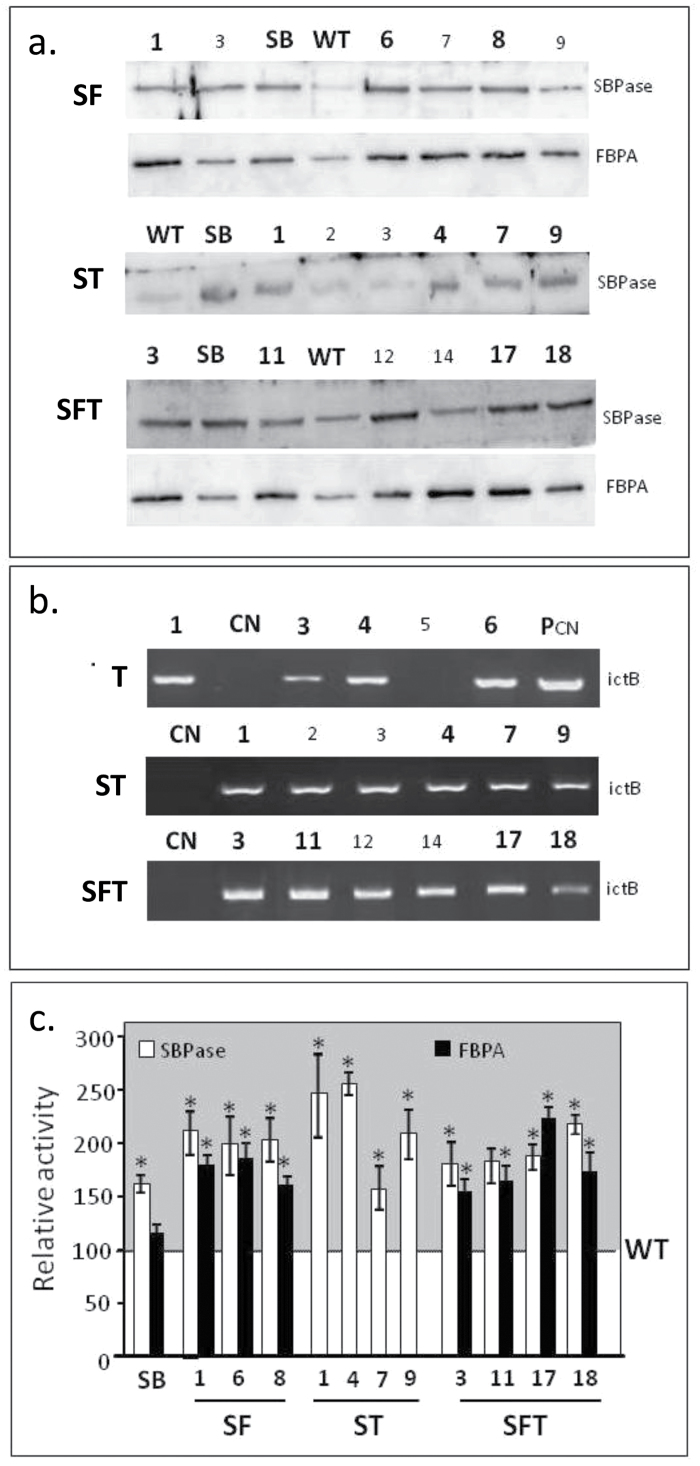
Fig. 1.
Molecular and biochemical analysis of the transgenic plants over-expressing SBPase (S), FBPA (F), and ictB (T). (a) Immunoblot analysis (SBPase and FBPA) of protein extracts from the fully expanded leaves of evaluated lines. (b) ictB transcript levels in lines T, ST, and SFT compared with a non-transformed control (CN); PCN=plasmid control. (c) SBPase and FBPA enzyme activity in fully expanded leaves from SF, ST, and SFT lines used in this study compared with WT and S lines previously studied (Lefebvre et al., 2005). Enzyme assays represent data from four or five independent plants per line (see Supplementary Fig. S3 at JXB online). An asterisk indicates lines which are statistically different from WT and SB lines (*P <0.05). Numbers in bold represent lines used in this study.

