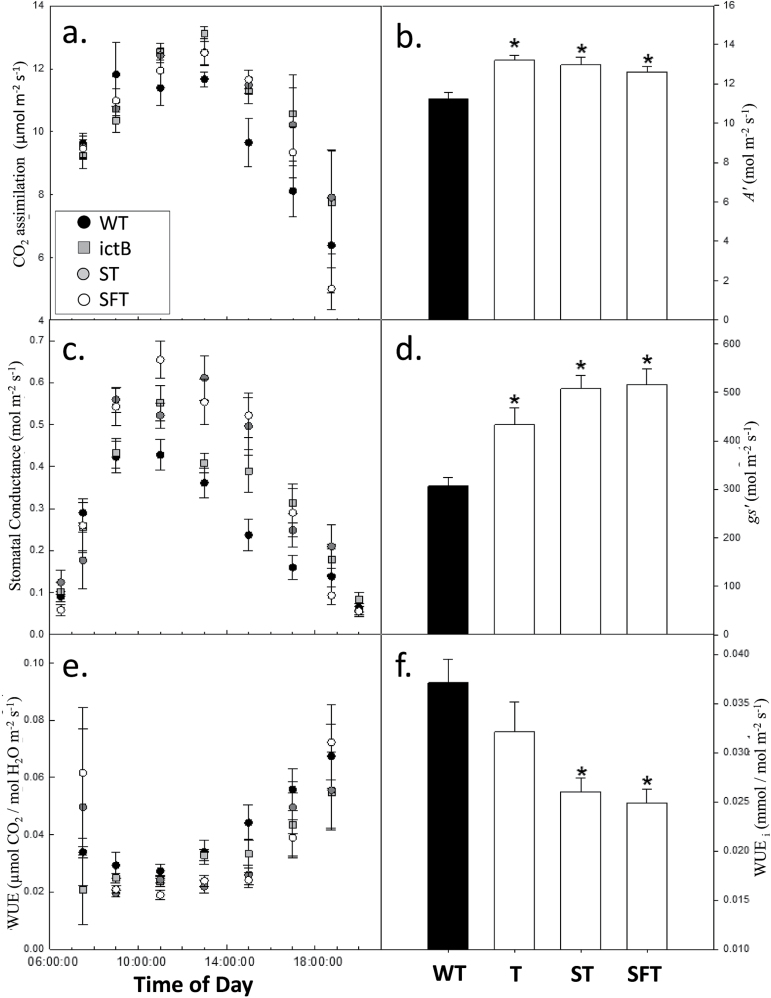
Fig. 5.
The diurnal progression of CO2 assimilation, stomatal conductance, and water use efficiency in the WT and transgenic plants. Plants were grown in greenhouse conditions as in Fig. 3. (a) Leaf photosynthesis (A), (c) stomatal conductance, and (e) intrinsic water use efficiency (A/g s=WUEi) were monitored over a 14h period. Each symbol represents the mean ±SE of five plants. For each transgenic group, two plants from each of four independent transgenic lines were evaluated and grouped together (eight plants per group). The integrated (b) carbon gain (A’), (d) water loss (gs’), and (f) total water use efficiency were calculated. An asterisk denotes a significant (<0.05) difference compared with WT plants. Lines over-expressing ictB (T), SBPase and ictB (ST), and SBPase, FBPA, and ictB (SFT) are represented.

