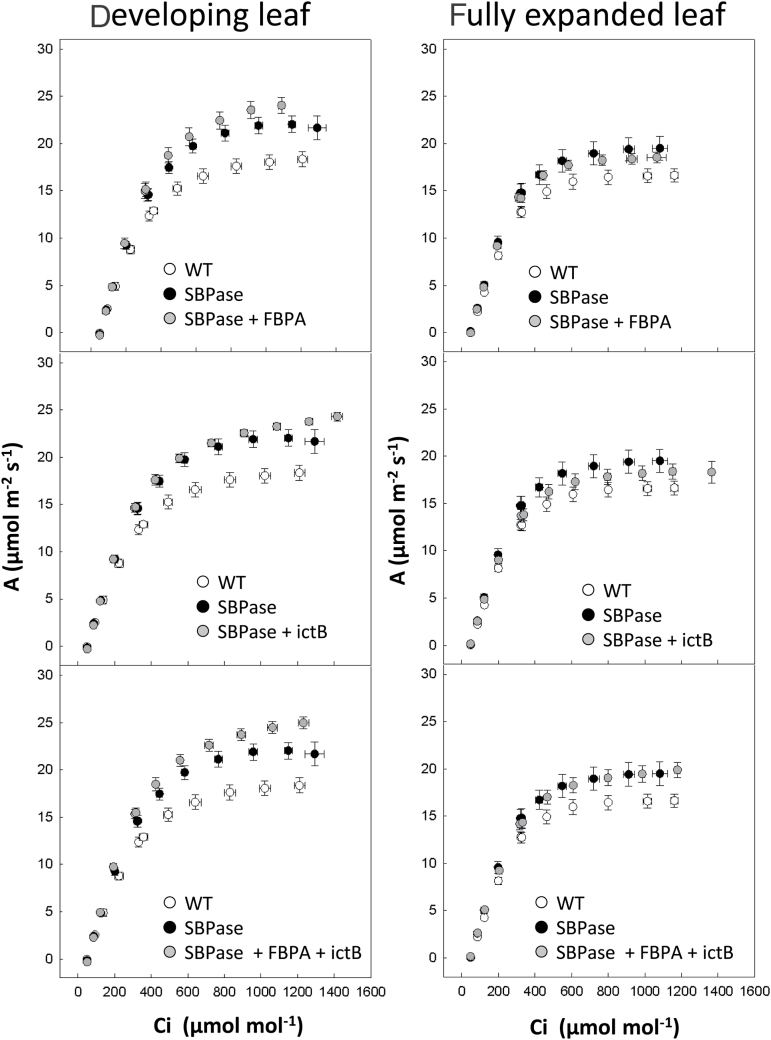
Fig. 7.
Photosynthetic responses of WT and transgenic plants grown in low light. Photosynthetic capacity of developing leaves (11–13cm) and fully expanded leaves (leaf 7) from low-light, greenhouse-grown wild-type and transgenic plants. Plants were grown in supplemented, fluctuating light at a maximum of 200–350 μmol m–2 s–1 light intensity. Photosynthetic carbon fixation rates were determined as a function of increasing CO2 concentrations at saturating-light levels. White circles represent the results from six wild-type plants, and black circles represent the results from eight SBPase over-expressing lines (Lefebvre et al., 2005). Grey circles represent 10–17 individual plants from 3–4 independent transgenic lines over-expressing SBPase+FBPA, SBPase+ictB, and SBPase, FBPA,+ictB.

