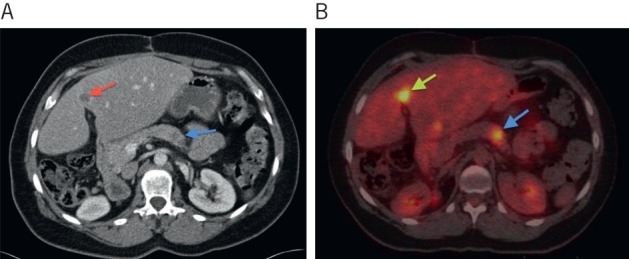
Figure 2.

Computed tomography (CT) showing a subtle hypoattenuating lesion in the pancreas (white arrow) (A) and positron emission tomography CT showing the pancreatic lesion as highly avid in keeping with a metastasis (white arrow) (B). A liver metastasis is also shown on both studies (black arrows).
