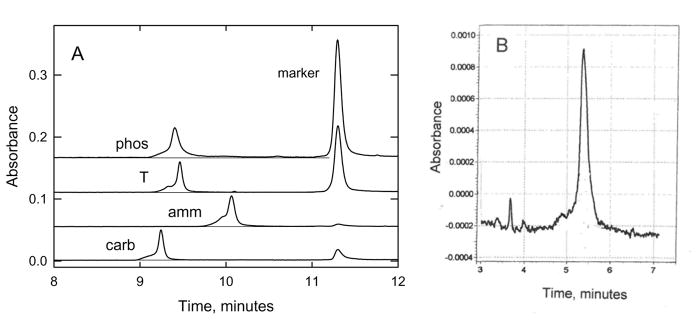
Figure 2.

Typical CE electropherograms observed for charge-modified DNAs. The absorbance at 254 nm (in arbitrary units) is plotted as a function of the time after injection of the sample into the capillary. (A), thymine-modified charge variants in 100 mM ammonium DM. The peaks on the left correspond to phos, T, amm and carb (top to bottom); the peaks on the right correspond to the marker ACCTGATCAG. Note the long tail following the peak observed for phos. The slow return of the absorbance to the baseline indicates that phos and the marker were interacting during electrophoresis (see text). (B), Linker-modified DNA, ss20/6, in 20 mM HEPES buffer.
