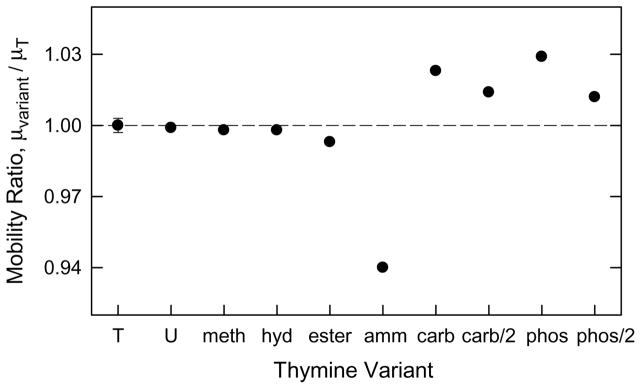
Figure 3.

Comparison of mobility ratios observed for the thymine-modified DNAs in 100 mM NH4+. Mobility ratio = mobility (variant) / mobility (sample T). The average standard deviation of the mobility ratios is indicated by an error bar appended to sample T.
