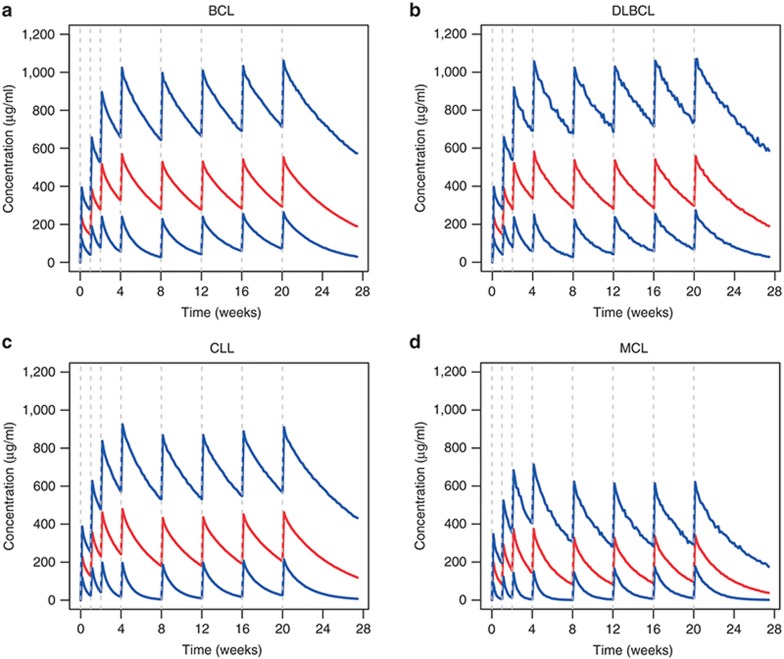
Figure 2.
Model-based simulations by diagnosis. Each patient from the analysis data set was used to create 100 simulated patients with the same covariates but different individual random effects. Concentration–time courses were simulated following 1,000 mg intravenous doses of obinutuzumab on days 1, 8, 15 of cycle 1, and day 1 of cycles 2–6. Residual variability was included. Once-a-day sampling was assumed. Medians (red) and 5th and 95th percentiles (blue) of the simulated concentrations are plotted. BCL, B-cell lymphoma; CLL, chronic lymphocytic leukemia; DLBCL, diffuse large B-cell lymphoma; MCL, mantle cell lymphoma.

