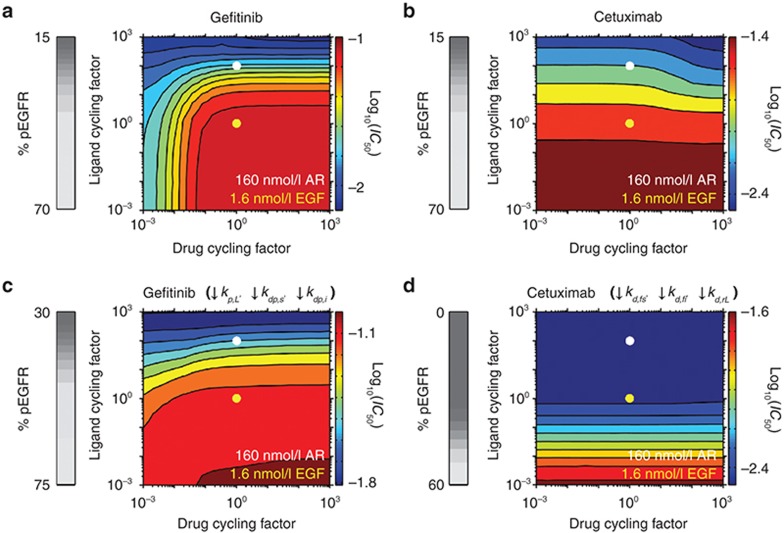
Figure 3.
Effects of the rates of cycling of ligand or therapeutic binding and unbinding. Gefitinib and cetuximab IC50 values were calculated for the indicated fold-changes in ligand or drug cycling factor, a constant by which the ligand or drug association and dissociation rate constants are multiplied such that binding/unbinding rates change without altering affinities. Ligand cycling rates corresponding to 1.6 nmol/l epidermal growth factor (EGF) and 160 nmol/l amphiregulin (AR) are indicated by the yellow and white dots, respectively. 160 nmol/l AR is equivalent to 1.6 nmol/l EGF with a ligand cycling factor of 100 because AR is treated as dissociating from EGFR 100 times faster than EGF and the 100-fold greater AR concentration leads to a 100-fold increase in AR's association relative to EGF. The analysis was performed for (a) gefitinib and (b) cetuximab with the base model parameters. (c and d) The simulations in panels (a) and (b) were repeated but with (c) the rate constants for phosphorylation within ligand-bound dimers (kp,L) and dephosphorylation at the cell surface and in the cell interior (kdp,s and kdp,i, respectively) reduced by 100-fold and (d) the rate constants for receptor dimerization at the cell surface and in the cell interior (kd,fs and kd,fi, respectively) and uncoupling of ligand-bound receptor dimers (kd,rL) reduced by 103-fold, respectively. For panels (a–d), the grey scale colorbars at left show the percent of phosphorylated EGFR (pEGFR) in the absence of drug as a function of ligand cycling factor. The log10(IC50), with IC50 in µmol/l units, as a function of ligand and drug cycling factors is shown in colored contour plots, with the color scale shown at right of each contour.

