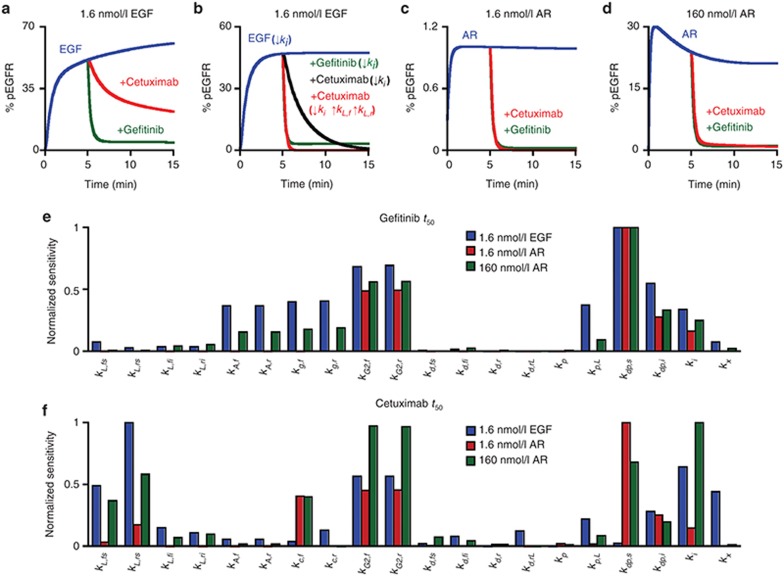
Figure 5.
Prediction of and local sensitivity analyses for the time scale with which gefitinib and cetuximab drive epidermal growth factor receptor (EGFR) dephosphorylation. The model was used to predict the percent of phosphorylated EGFR (% pEGFR) observed in response to a 5 min treatment with (a and b) 1.6 nmol/l EGF, (c) 1.6 nmol/l amphiregulin (AR), or (d) 160 nmol/l AR, followed by a chase with 1 μmol/l gefitinib or cetuximab. For (b), the internalization rate constant (ki) was set to zero at t = 0 min for all conditions and the rate constants for ligand-receptor association and dissociation (kL,f and kL,r, respectively) were increased by 100-fold for the cetuximab condition at t = 5 min. (e and f) Sensitivity of t50 values to perturbations of 10-fold in each of the model parameters was computed for (e) gefitinib or (f) cetuximab. Sensitivities were reported as the absolute value of the difference in the logarithm of the base t50 and the perturbed t50 and then normalized to the maximum. Sensitivity analyses were performed for 1.6 nmol/l EGF, 1.6 nmol/l AR, and 160 nmol/l AR and 1 μmol/l therapeutic.

