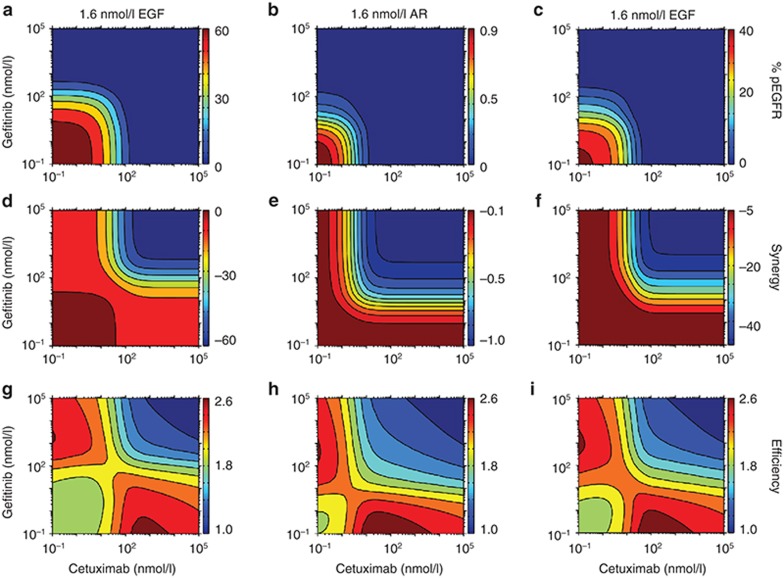
Figure 6.
Effects of gefitinib and cetuximab cotreatment. (a–c) The model was used to predict the steady-state percent of phosphorylated epidermal growth factor receptor (pEGFR) as a function of cetuximab and gefitinib concentrations for (a) 1.6 nmol/l EGF, (b) 1.6 nmol/l amphiregulin (AR), or (c) 160 nmol/l AR. (d–f) Synergy, defined as the reduction in receptor phosphorylation resulting from cotreatment minus the reductions in receptor phosphorylation following treatment with each therapeutic alone, was calculated as a function of cetuximab and gefitinib concentrations for the same ligand concentrations as in (a–c). (g–i) To estimate therapeutic efficiency, pEGFR (a–c), synergy (d–f), and the logarithm of the sum of the drug concentrations were scaled to each range between 0 and 1 and then summed for all drug combinations. Based on this definition, therapeutic efficiency is highest for low pEGFR, high synergy, and low amount of drug.

