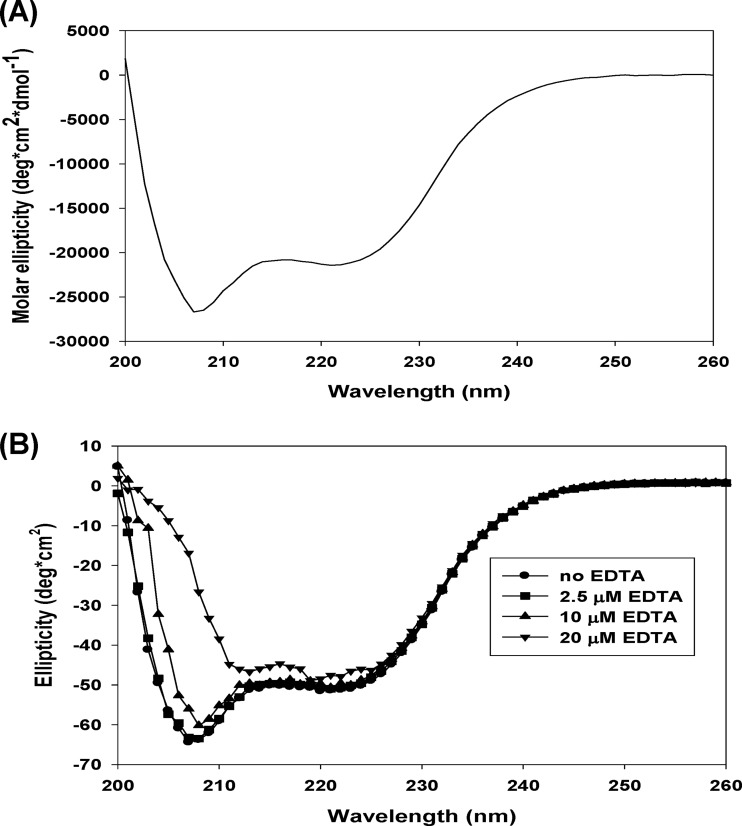
FIG 4.
EDTA chelation alters the secondary structure of the hMPV M2-1 protein. (A) Circular dichroism (CD) spectroscopic analysis of the M2-1 protein. A 2 μM M2-1 protein was analyzed by a UV spectropolarimeter at a wavelength range of 190 to 260 nm at a scanning speed of 50 nm per min. Data are averages from 10 individual readings. (B) Alteration of the M2-1 structure by EDTA. A 2 μM M2-1 protein was incubated with increasing concentrations of EDTA, and CD spectra were recorded.

