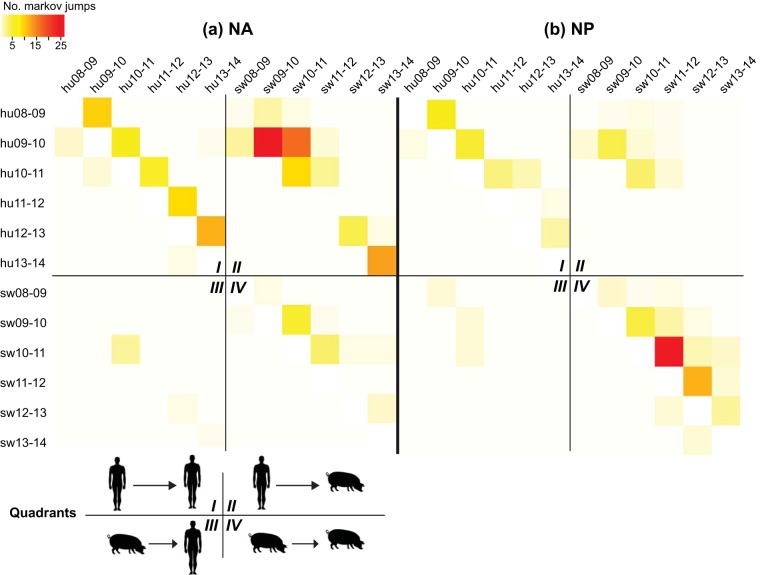
FIG 2.
Heat map of virus transmission between humans and swine. Markov jump counts measure the number of inferred location state transitions, modeled by a continuous-time Markov chain process, that occur along the branches of the phylogeny. The intensity of the color (red, high; white, low) reflects the number of Markov jump counts between one temporally defined host population (y axis) and another (x axis), which have been abbreviated (e.g., hu08-09, viruses collected in humans during the 2008-2009 epidemic; sw08-09, swine viruses collected during the 2008-2009 epidemic). The results are presented separately for the NA (a) and NP (b) segments. For clarity, each heat map has been divided into four quadrants that represent linkages between human viruses from a seasonal epidemic and human viruses from a different (usually preceding) epidemic (i.e., human-to-human transmission) (I), linkages between swine viruses from a seasonal epidemic and human viruses from a different (usually preceding) epidemic (i.e., human-to-swine transmission) (II), linkages between human viruses and swine viruses (i.e., swine-to-human transmission) (III), and linkages between swine viruses and swine viruses from a different (usually preceding) epidemic (i.e., swine-to-swine transmission) (IV).

