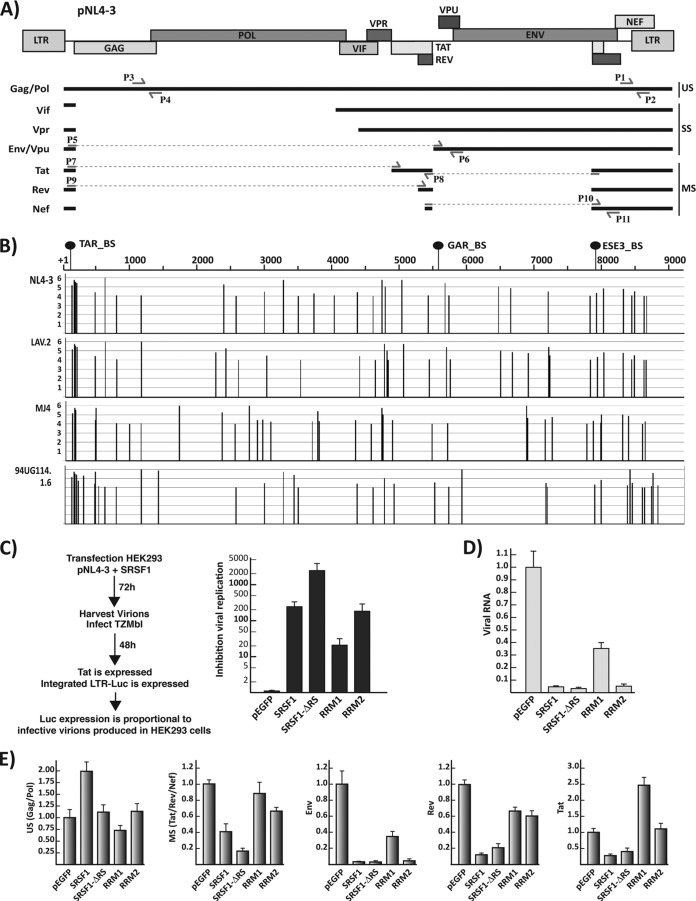
FIG 2.
SRSF1 inhibition of HIV-1 replication. (A) Schematic representation of the pNL4-3 proviral clone. The relative position of the viral genes is indicated on the map on top. The main mRNAs—classified as unspliced (US), singly spliced (SS), and multiply spliced (MS)—are indicated. Multiple mRNAs coding for each viral gene are generated by the choice of several alternative 5′ and 3′ splice sites (10). Locations of the primers utilized in the qPCR assays to amplify the total viral mRNA (P1 and P2) and specific for the gag/pol (P3 and P4), env/vpu (P5, P6), rev (P9 and P8), tat (P7 and P8), and the multiple spliced mRNAs (tat, rev, and nef) (P10 and P11) are indicated. (B) SRSF1 binding sites within the viral transcript. The sequences of four molecular clones were analyzed for consensus SRSF1 binding sites utilizing the ESEfinder 3.0 (29). A high-threshold stringency of 4 was chosen for the SRSF1 matrix analysis to reduce the number false positives and the significance of the output data. The position and score of each predicted SRSF1 binding site is plotted for each viral molecular clone in relation to the standard NL4-3 genome map. The location of the SRSF1 binding sites that have been experimentally characterized is indicated in relation to the NL4-3 genome (top). (C) Viral replication assay. HEK293 cells were cotransfected with the viral expression clone pNL4-3 and the indicated SRSF1 plasmid. Viral production was assayed as indicated in the schematics on the left. The amount of supernatant utilized for the assay was normalized for the amount of cells present in the plate. Inhibition of viral replication was defined as the: the luciferase counts from TZM-bl infected with the supernatant of HEK293 transfected with pNL4-3 and the control pEGFP/the luciferase counts from TZM-bl infected with the supernatant of HEK293 transfected with pNL4-3 and the indicated SRSF1 clone. (D) Quantification of total viral mRNA from the transfected HEK293 cells by qPCR (primers P1 and P2). The results are visualized as the fold increase or decrease versus the control pEGFP transfection. (E) Quantification of the single viral transcripts. Expression of the gag/pol, env, tat, rev, and multiply spliced mRNAs relative to the total amount of viral transcript was calculated by normalizing the amount of specific transcripts for the total amount of viral mRNA in each sample, and each value is expressed as the fold increase or decrease versus control pEGFP transfection. All data are represented as means ± the SEM.

