Fig. 4.

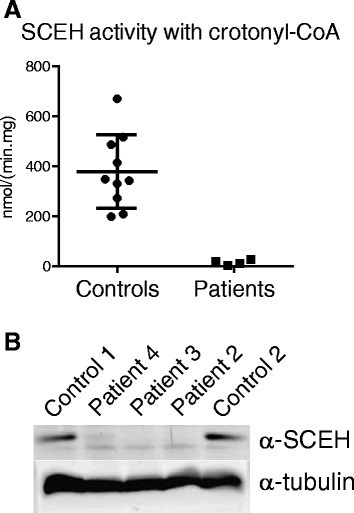
SCEH enzyme activity and protein expression in patients fibroblasts (a) SCEH enzyme activity with crotonyl-CoA as substrate measured in fibroblasts of control subjects (n = 10) and fibroblasts of patients 1–4. Whiskers indicate mean ± SD. Patient fibroblasts show a markedly reduced SCEH activity. b Immunoblot analysis with antibodies against SCEH in fibroblasts of two control subjects and fibroblasts of patients 2–4. The lower panel shows the loading control with antibodies against α-tubulin. Patient fibroblasts show reduced SCEH protein expression
