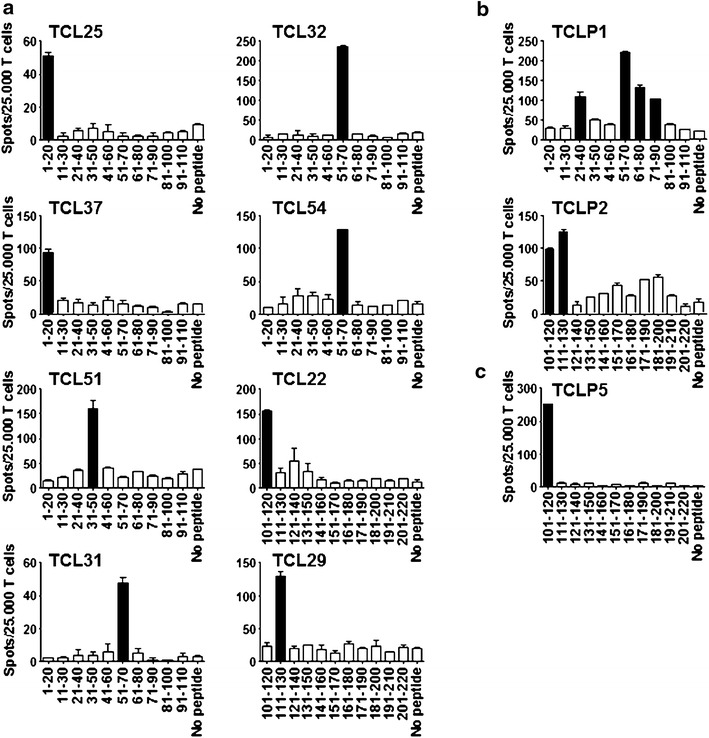
Figure 4.

Induction of T cell specificity against multiple SLLP1 peptide epitopes. SLLP1-reactive T cell cultures were generated from PBMC from three healthy donors: a UKE-1, b UKE-2, and c UKE-3. Each plot represents an SLLP1-specific T cell line (TCL). IFN-γ secretion was measured in ELISPOT assay after restimulation with T-APC loaded with single peptides. T cells stimulated with unloaded T-APC were used as background controls (no peptide). Bars indicate the number of IFN-γ spots per 25,000 T cells (mean + SEM). Black bars indicate significant reactivity above the background value + 3STD.
