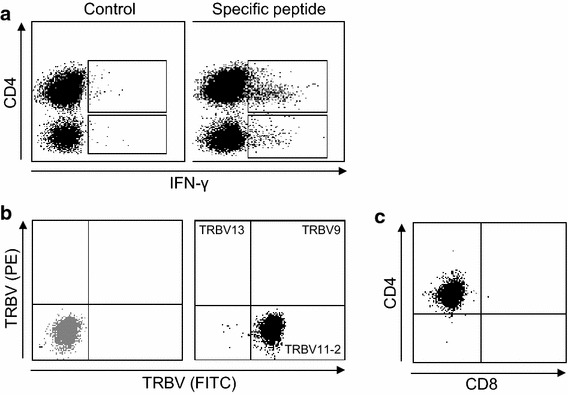
Figure 5.

Phenotype of SLLP1-specific T cells. a T cell lines were restimulated with their cognate SLLP131–50 peptide or irrelevant control peptide and secretion of IFN-γ was measured on the cell surface by flow cytometry. b T cell clone number 1 (TCC1) was stained with an antibody cocktail containing three different TRBV antibodies (PE, FITC, PE/FITC). The gray dot plot represents the isotype control. c SLLP-1-specific T cell clones analyzed phenotypically using staining with anti-CD4 and anti-CD8 antibodies followed by flow cytometry.
