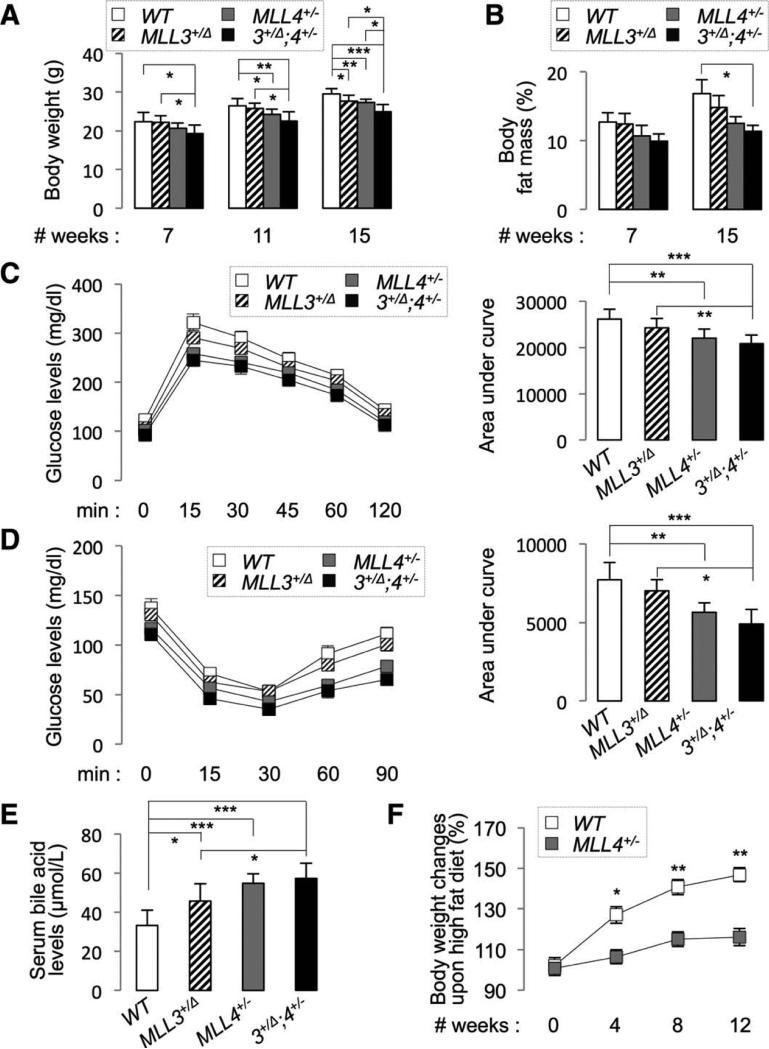
Fig 1.
MLL4+/− mice show strong metabolic phenotypes. (A-E) Body weight (A), body fat mass (B), glucose tolerance (C), insulin sensitivity (D), and serum BA levels (E) were measured for 16-week-old male WT, MLL3+/Δ, MLL4+/−, and MLL3+/Δ;MLL4+/− mice (n = 6~7). Similar results were also obtained with female animals. Serum BA levels were measured at ZT10 (E). (F) Starting with 8-week-old male WT and MLL4+/− mice (n = 4), body-weight changes were measured for the next 12 weeks of HFD feeding as indicated and the results were plotted as percent increase in body weight relative to the beginning of HFD (0 week). P values are for differences between WT and MLL4+/− mice (F).

