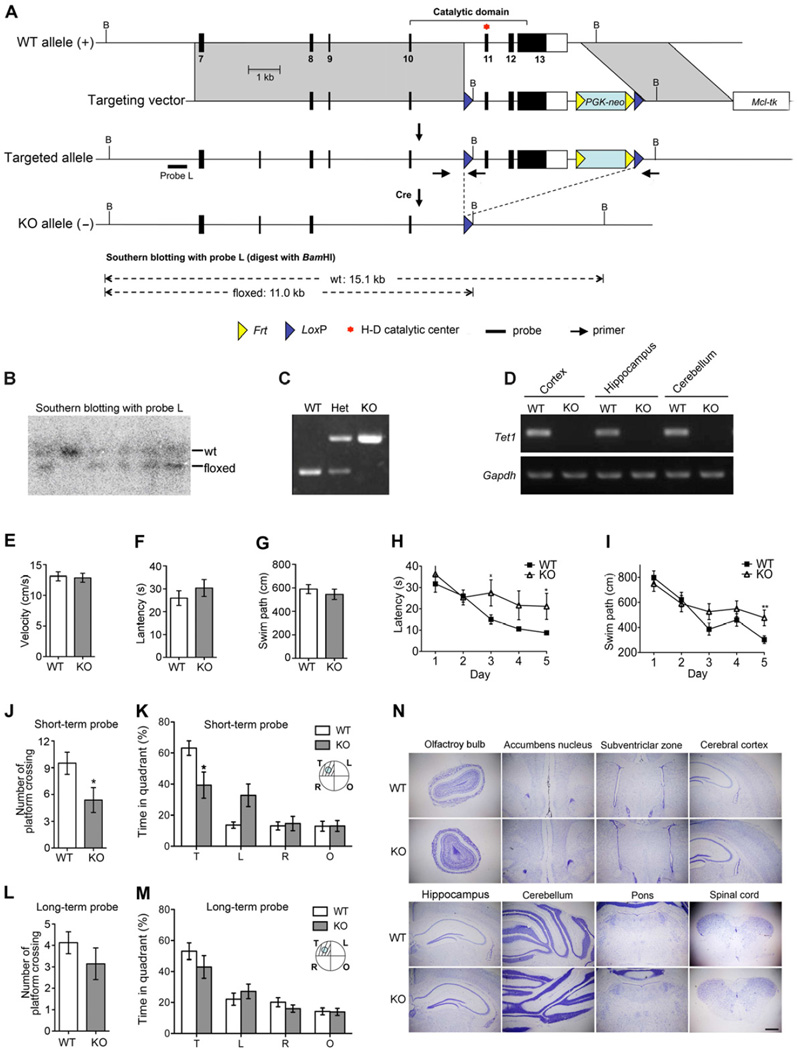
Figure 1. Tet1 Deficient Mice Show Normal Brain Development but Impaired Spatial Learning and Memory.
(A) Gene targeting strategy. Coding exons are shown as filled boxes and the 3’ non-coding part of exon 13 is shown as a blank box.
(B) Southern blot confirmation of targeted ES clones. Fragments corresponding to the wild-type allele (wt) and the floxed allele are indicated.
(C) PCR genotyping of mutant mice. Primer locations are indicated in panel A and their sequences are listed in the method.
(D) Loss of Tet1 mRNA confirmed by RT-PCR assay. Gapdh was used for sample normalization.
(E) – (G) Visible platform screening showed no significant differences of visual acuity and mobility between WT and the whole-body knockout (KO) mice. (E) Average swim speed. (F) Latency to the visible platform. (G) The length of swim path to the visible platform.
(H) and (I) Spatial acquisition performances were recorded every day during 5-day training. (H) Escape latency. (I) Swim path to the hidden platform.
(J) and (K) Probe trial for short-term memory retention was carried out 24 hours after the last training. (J) Platform crossing. (K) Time in the target quadrant (T) and other quadrants (L, R &O).
(L) and (M) Probe for long-term memory retention was carried out 3 weeks after the last training. (L) Platform crossing. (M) Time in the target quadrant (T) and other quadrants (L, R &O).
(N) Tet1 deficiency is compatible with brain development. Shown are Nissl-stained coronal sections from Tet1 whole-body knockout mice at postnatal day 60. Scale bar, 500 µm.
For behavioral tests, 9 pairs of 4-month-old male mice were examined; For (E) – (G) and (J) – (M), two-tailed t-test was used in statistics; For (H) and (I), two-way ANOVA was used in statistics; * P < 0.05, **P < 0.01; All data are presented as mean ±s.e.m.

