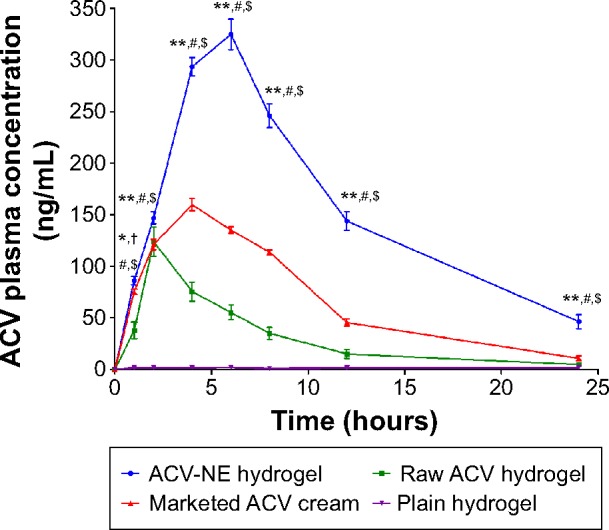
Figure 6.

Mean plasma concentration-time profiles for ACV after transdermal administration of the different formulations.
Notes: The data represent the mean ± standard deviation (n=6). *P<0.05; **P<0.001. †ACV-NE hydrogel compared with the marketed (reference) ACV cream. #Compared with raw ACV hydrogel (positive control). $Compared with plain hydrogel (negative control).
Abbreviations: ACV, acyclovir; NE, nanoemulsion.
